

CIM Third Quarter Market Commentary & Outlook
Key Considerations:
- In the most recent KPMG study, over 80% of CEO’s surveyed expect a recession in the next twelve months
- Investors can now achieve tax-free yields of 5% or more, which equates to 8.5% to 9.00% on taxable equivalent basis, for those in the highest federal tax bracket.
- The Bloomberg Recession Probability Model now stands at 100%.
- The front-end of the muni curve is quite rich in our view. The curve is almost perfectly flat 2 years to 5 years. Nominal yields are roughly the same regardless of maturity.
- Oil, iron ore, copper, wheat, silver, nickel, and palladium were down -27%, -20%, -29%, -29%, -29%, -53% and -27% respectively from their peaks.
- 30 year bond yields were roughly 0.50% lower than 2 year bond yields.
- Following every recession since the early 80’s, the Fed has reversed the entirety of all its prior interest rate hikes.
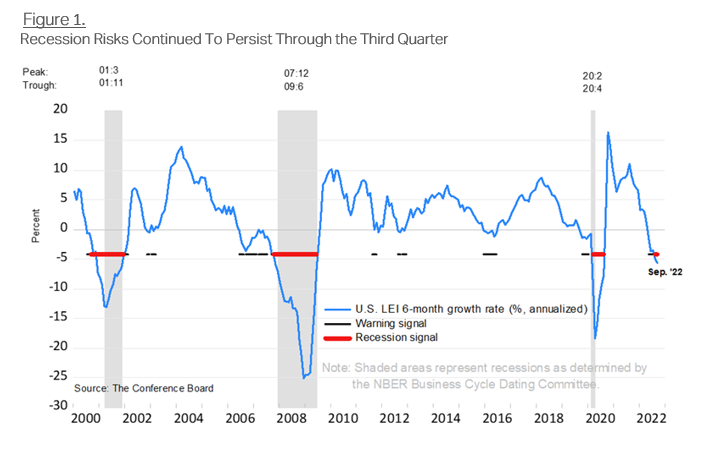
- We have seen six consecutive months of weakening Leading Economic Indicators (LEI), from the Conference Board.
Andrew Clinton
CEO
The environment that investors have faced throughout 2022 has grown more challenging by the day. Market uncertainty has risen dramatically as a result of the Russian invasion of Ukraine, the threat of an expanding war, the increasing likelihood of severe economic contraction in the US, Europe, and Asia, while the Federal Reserve tightens monetary policy at the fastest cadence in history. These risks, both real and perceived, have resulted in the destruction of tens of trillions of dollars in wealth, year-to-date. This experience has understandably taken a serious and significant toll on US consumer sentiment, which is now at the lowest level in over 50 years. Expectations for contraction in domestic and multinational corporate profitability have also increased meaningfully and are now adding to the market volatility that persists. Market and economic conditions portend a period of deep domestic and global economic contraction, which we expect to accelerate in the coming months, an outlook supported by the over 1,000 CEO’s who participated in the most recent KPMG study. In the study, over 80% of CEO’s surveyed expect a recession in the next twelve months, while roughly half the CEO’s anticipate cutting jobs within their organizations during that time. These deep and disruptive, market crosscurrents had a substantial impact on bond markets and municipal bonds specifically during the third quarter.
The rise in interest rates, year-to-date, has resulted in the most severe downward, bond price adjustments in 50 years. At moments like these we are reminded that Fed rate hikes act with a “long and variable lag”. Historically, it takes roughly four to six quarters for rate hikes to fully impact broader economic activity, implying that almost the entirety of Fed rate hikes, which began in March if this year, have yet to be felt in any meaningful way in the US economy. Yet, the pace and ferocity with which the Fed has raised interest rates continues at the fastest rate in US history. The Fed is also actively reducing its balance sheet through Quantitative Tightening (QT). When one considers the totality of the tightening that has occurred, together with the generational strengthening of the US dollar, the total impact of Fed action on financial conditions in 2022 equates to roughly 600 basis points of tightening, according to economist David Rosenberg. Fed Chair Powell has stated clearly that the Fed’s actions will result in “pain” for US consumers. We interpret this to mean that the Fed, in the clearest terms possible, is informing the public that it doesn’t believe tightening “too much” is a policy mistake, rather, it is a deliberate act, as they seek to push the US economy into a deep recession in order to reverse the stagflationary forces that persist. Therefore, the odds of a recession, over the next twelve months, are extremely high, illustrated clearly by the Bloomberg Recession Probability Model, which now stands at 100%. The Fed also appears committed to hike yet another 0.75%, or 75 basis point, in November, and perhaps as much as another 0.75% in December. As such, the outlook for US economic growth looks decidedly bleak. Fed Fund futures are forecasting a terminal rate of roughly 5%, while the 10-year Treasury yield stands at roughly 4.19%. The Fed’s terminal rate is already priced into Treasury bonds, absent another adjustment upward by the Fed. The impact of the rate increases can also be seen in the level of 30-year fixed mortgage rates, now approaching 7%, which is causing a significant proportion of the US residential real estate market to become largely unaffordable for many home buyers. What is remarkable is the fact that Fed hikes continue in the face of a material decline in commodities prices, as almost the entirety of the commodities complex is now in a bear market, down more than 20% from its highs. At the time of this writing oil, iron ore, copper, wheat, silver, nickel, and palladium were down -27%, -20%, -29%, -29%, -29%, -53% and -27% respectively from their peaks. This is a clear indication that the inflationary forces the Fed is uniquely focused on arresting, are already beginning to dissipate. Yet, the Fed is tightening financial conditions further. As our clients and followers know, Clinton Investment Management has been anticipating a slowdown in economic activity, together with a peak in inflation during the second or third quarter 2022 for some time. While CPI remains stubbornly high, we have seen six consecutive months of weakening Leading Economic Indicators (LEI), from the Conference Board. Never before have we seen six consecutive months of weakening LEI’s without the US economy subsequently experiencing a recession, see Figure 1.
Investors can now achieve tax-free yields of 5% or more, which equates to 8.5% to 9.00% on taxable equivalent basis, for those in the highest federal tax bracket. At these levels, investors can lock in annualized returns in high quality muni and enjoy equity like returns, for the next 20 years for example, without the fear of the -40.00% to -50.00% drawdown that has been in experienced in the equity markets every 10 years or so.
We should begin to see further confirmation of a deterioration in economic activity in the coming months. We are following guidance from corporations in their upcoming earnings announcements for clues as to the exact timing, depth, and duration of the coming slowdown.
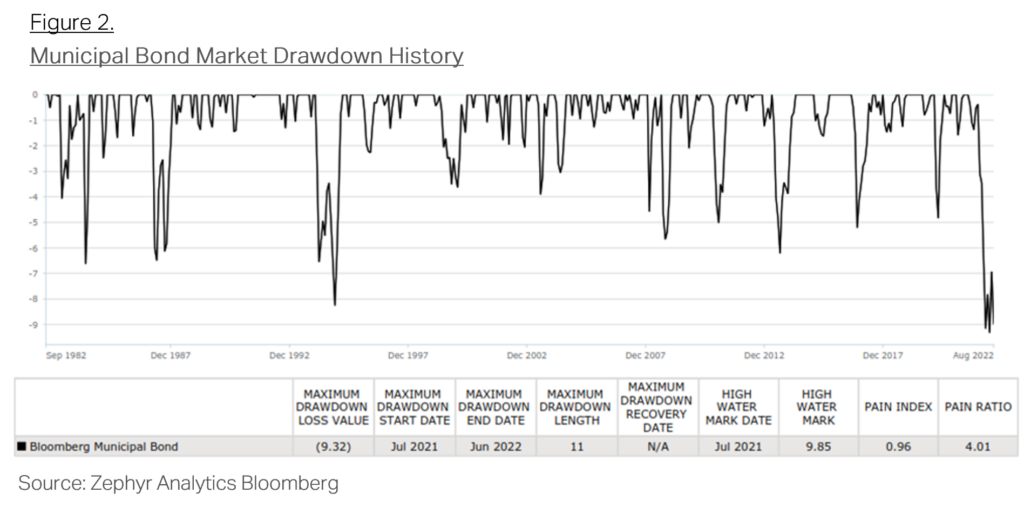
In sympathy with Treasury yields, municipal bond yields moved higher during Q3 making September one of the worst months, from a total return perspective, in municipal bond market history. The muni market was down over -3.84% in September according to the Bloomberg Muni Index. While it may come as small consolation to municipal bond investors, it is important to note that munis continue to be one of the best performing asset classes, from a total return perspective, year-to-date. The Bloomberg Muni Index was down approximately -12% year-to-date at the end of the third quarter while Treasuries, Corporate bonds, and the S&P 500 were down -15%, -14%, and -24% respectively, as of 9/30/22. At moments like these we believe it’s important to revisit prior periods of rising rates to better understand the frequency, depth, and duration of municipal drawdowns in order to derive greater clarity and confidence as we look forward. As you can see in Figure 2, periods of rising muni yields are not only frequent but are often quite brief. The longest drawdown period, going back to 1982, was 11 months. The current drawdown cycle is approaching 10 months.
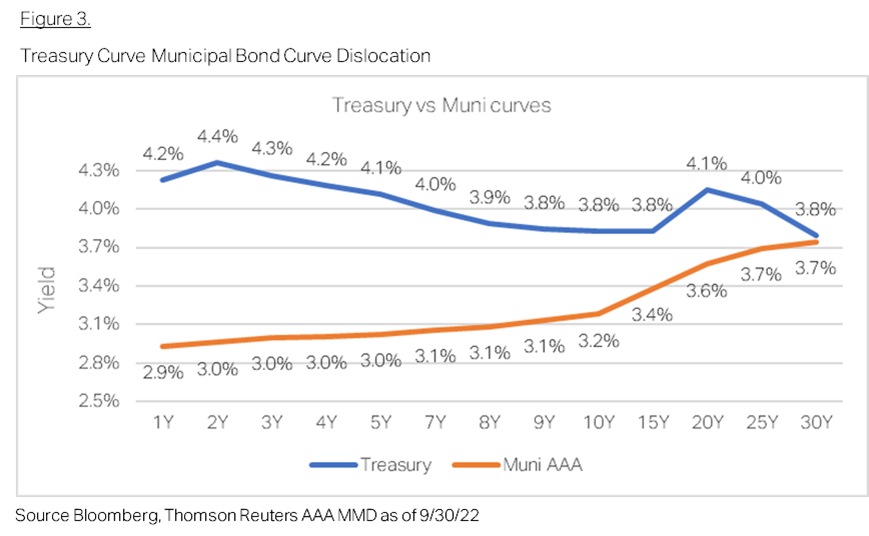
While the worst bond market in history has been unpleasant and unwelcome, which is perhaps the understatement of this millennium, we know from experience that periods of market upheaval and dislocation create extraordinary opportunities. Investors with appropriate investment horizons can enjoy the benefits of those dislocations as markets normalize over time. An example of the severity of current market dislocations can be seen in comparing the shape of the Treasury yield curve to that of the AAA rated, tax-free muni curve. The Treasury curve is inverted by approximately -0.50%, or -50 basis points, from 2 years to 30 years bonds (2s/30s), meaning 30 year bond yields were roughly 0.50% lower than 2 year bond yields. Yet, 30 year muni bond yields are approximately +0.91% or 91 basis points, higher than 2 year muni bonds. We believe the Treasury curve is accurately reflecting the likelihood that long-term interest rates will be materially lower in the future, creating an attractive opportunity and entry point in longer intermediate and long-duration muni bonds, as the muni market has yet to price in the Treasury market reality. The front-end of the muni curve is quite rich in our view. The curve is almost perfectly flat 2 years to 5 years. Nominal yields are roughly the same regardless of maturity. Yet, muni to Treasury ratios are quite rich in short maturities from a historical perspective, making short-duration munis unattractive and likely to underperform over time in our view. This dislocation is being driven by record setting withdrawals of over $100 billion out of open-end municipal bond mutual funds, year-to-date, see Figure 3.
Investors can lock in annualized returns in high quality muni and enjoy equity like returns, for the next 20 years for example, without the fear of the -40.00% to -50.00% drawdown that has been in experienced in the equity markets every 10 years or so.
Outflows have continued to pressure longer duration muni yields higher to levels we have not seen since the Great Financial Crisis, over 14 years ago. Investors can now achieve tax-free yields of 5% or more, which equates to 8.5% to 9.00% on taxable equivalent basis, for those in the highest federal tax bracket. At these levels, investors can lock in annualized returns in high quality muni and enjoy equity-like returns, for the next 20 years for example, without the fear of the -40.00% to -50.00% drawdown that has been in experienced in the equity markets every 10 years or so.
Municipal credit quality remains stable as state and local governments continue to benefit from higher pass-through corporate tax collections and higher inflationary tax revenue, derived from higher nominal sales tax collections. New issuance in the municipal bond market is down over 10% from this time last, year given that many state and local governments have sufficient cash and liquidity such that they don’t need to borrow. They may also be considering the likelihood that interest rates could be considerably lower next year this time, which would be a better time to access the capital markets, enabling them to achieve lower interest costs over time. Heading into, what we expect will be a severe an economic slowdown or recession, state and local governments, are, quite literally, in the strongest fiscal health they have enjoyed in the past 30 years. Therefore, we continue to believe the greatest value can be found in lower investment grade bonds where default risk is consistent with AAA quality, as shown in Moody’s credit default studies going back 50 years, and tax-free yields are the highest, while spreads to AAA rated bonds are the widest.
As we look to year-end, it is reasonable to expect that market uncertainty will persist for some time. However, we also expect 2023 to be a much more constructive year for high quality fixed income more broadly and munis in particular. Following every recession since the early 80’s, the Fed has reversed the entirety of all its prior interest rate hikes. While we understand there are calls by some in the investing community who believe this time is different and that high rates of inflation will persist forever, that outlook is inconsistent with the last 50 years of monetary policy. That is not to say that that outcome is impossible, it is simply to say that it is a very low probability event over the intermediate and longer term, given what we know as students of economic theory and Fed policy. Having said that, we expect 2023 to be a challenging year for the US and Global economies, as well as risk assets more broadly. However, we also expect the Fed’s tightening cycle to come to end as well. As the economy slows further, the Fed will likely be forced to cut rates deeply to reverse the trend in economic contraction. While we have no clarity as to whether the Fed will be forced to return to the zero bound, it is reasonable to believe that materially lower interest rates will be necessary to recover from what we believe is not a policy mistake by the Fed, pushing the US economy into a recession, but a deliberate act. As investors consider the best way forward, it is important to remember that the asset class that enters the recession first also typically exists first. That would mean fixed income should perform well over the next 12 to 18 months. As challenging as this year has been, and continues to be, we encourage our clients and investors to remain calm and confident in the knowledge that this too shall pass, and better days are ahead for fixed income and municipal bond investors.
If you should have any questions about this content or the fixed income and municipal bond markets more broadly, please do not hesitate to reach out to us directly.
Best,
Andrew Clinton
CEO
Please remember that past performance may not be indicative of future results. Different types of investments involve varying degrees of risk, and there can be no assurance that the future performance of any specific investment, investment strategy, or product,madereference to directly or indirectly in this newsletter (article), will be profitable, equal any corresponding indicated historical performance level(s), or be suitable for your portfolio. Due to various factors, including changing market conditions, the content may no longer be reflective of current opinions or positions. Moreover, you should not assume that any discussion or information contained in this newsletter (article) serves as the receipt of, or as a substitute for, personalized investment advice from Clinton Investment Management, LLC. To the extent that a reader has any questions regarding the applicability of any specific issue discussed above to his/her individual situation, he/she is encouraged to consult with the professional advisor of his/her choosing. The PSN universes were created using the information collected through the PSN investment manager questionnaire and use only gross-of-fee returns. The PSN/Informa content is intended for use by qualified investment professionals.Please consult with an investment professional before making any investment using content or implied content from any investment manager. A copy of our current written disclosure statement discussing our advisory services and fees is available for reviewupon request.