

Municipal Credit Opportunities
Annualized Returns (%)
As of 12/31/2024
Inception Date: 09/30/2014
Returns less than one year are not annualized. Net of fee performance is net of actual fee.
Past performance is not a guarantee of future performance.
Growth of $1 Million
Annualized Return
| QTD | YTD | 1 YEAR | 3 YEAR | 5 YEAR | 10 YEAR | *SINCE INCEPTION | |
| Muni Credit Opportunity Composite - Gross | -1.16% | 2.05% | 2.05% | -1.35% | 1.27% | 3.26% | 3.36% |
| Bloomberg Muni Index | -1.22% | 1.05% | 1.05% | -0.55% | 0.99% | 2.25% | 2.33% |
| Muni Credit Opportunity Composite - Net | -1.24% | 1.71% | 1.71% | -1.69% | 0.90% | 2.84% | 2.94% |
Portfolio Characteristics
CURRENT YIELD
4.61%
YIELD TO MATURITY
4.41%
YIELD TO WORST
4.06%
TAXABLE EQUIVALENT YIELD TO WORST*
6.86%
The taxable equivalent yield represents the yield that must be earned on a fully taxable investment in order to equal the tax-exempt yield of the particular composite. The taxable equivalent yield is calculated by dividing the tax exempt yield by 1- the maximum federal income tax rate of 40.8% (37% federal + 3.8% Medicare tax).
Sector Distribution
Maturity Distribution
Clinton Investment Management LLC (CIM), a SEC registered investment adviser, claims compliance with the Global Investment Performance Standards (GIPS®) and has prepared and presented this report in compliance with the GIPS standards. CIM has been independently verified for the periods May 31, 2007 through December 31, 2022. The verification report is available upon request. A firm that claims compliance with the GIPS standards must establish policies and procedures for complying with all the applicable requirements of the GIPS standards. Please review the firm's ADV for additional information about risks and fees. Verification provides assurance on whether the firm’s policies and procedures related to composite and pooled fund maintenance, as well as the calculation, presentation, and distribution of performance, have been designed in compliance with the GIPS standards and have been implemented on a firm-wide basis. Verification does not provide assurance on the accuracy of any specific performance report.
Notes:
1. CIM is an independent registered investment adviser. CIM was established in 2007 and primarily manages fixed income products for high-net-worth, ultra-high-net worth, and institutional clients.
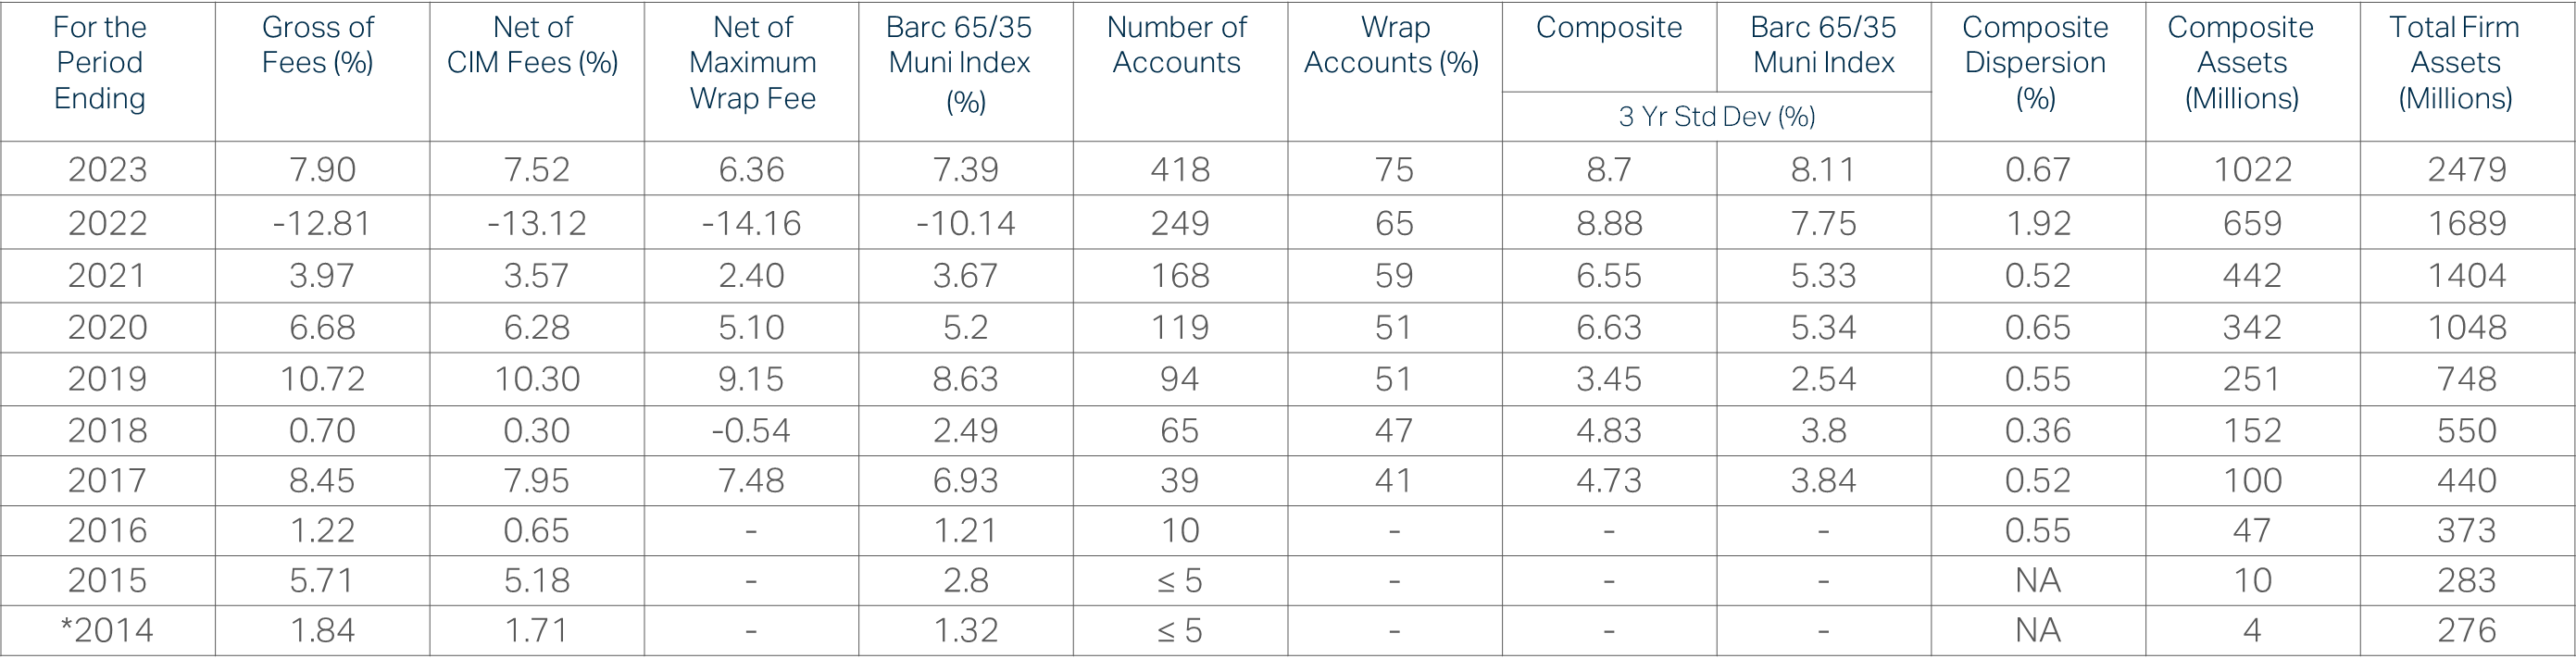
2. The Municipal Credit Opportunities composite includes portfolios that invest in municipal bonds. The objective of the composite is to track and/or outperform the benchmark in any given cycle. This strategy seeks to enhance portfolio income and deliver total returns that are similar to or higher than that of its benchmark, the Bloomberg Barclays Municipal 65% HG/35% HY Index, through investment in lower to below investment grade securities. Other major statistical factors are considered when constructing portfolios but may not be primary constraints such as duration position, sector allocation, and credit quality selection. Leverage and derivatives are not used.
3. The composite consists of fully discretionary, fee paying accounts under management, including terminated accounts for the period they were fee paying accounts. The composite's creation and inception date is *September 30, 2014.
4. The US dollar is the currency used to express performance.
5. The benchmark for the composite is the Bloomberg Barclays Municipal 65%HG/35%HY Index which measures the performance of the blended US high grade (65%) and high yield (35%) municipal bond universe. It includes approximately 53,638 municipal issuers. It is constructed to provide a comprehensive and unbiased blended municipal bond market barometer. Please note an investor cannot invest directly in an index.
6. Gross-of-fees performance returns represent returns prior to the deduction of management fees but after all trading expenses. Net-of-CIM-fees performance returns are calculated by deducting the actual CIM investment management fee from the gross returns. Net of CIM Fee is considered GIPS supplement information, since some accounts may incur additional wrap fees for investment management and custodial fees, which are not included in CIM net performance.
7. The performance numbers include the reinvestment of income and capital gains.
8. Internal dispersion is calculated when five or more portfolios were in the composite for the entire year using the Gross asset-weighted standard deviation of those portfolios that were included in the composite for an entire year. The 3-Year Standard Deviation represents the annualized standard deviation of actual Gross composite and benchmark returns, using the rolling 36-months ended each year-end.
9. Past performance is not indicative of future returns. Actual results may differ from the composite results depending upon the size of the account, investment objectives, guidelines and restrictions, inception of the account and other factors. Investments in the strategy carry risks, including possible loss of principal. Carefully consider the Strategy’s investment objectives, risks, and expenses before investing. Certain information has been obtained from third-party sources believed to be reliable, but we cannot guarantee its accuracy or completeness.
10. The fee schedule is: 0.85%. Investment advisory fees are negotiable based on account size, investment strategy and relationship type and may differ between accounts.
11. Policies for valuing portfolios, calculating performance, and preparing GIPS Reports and a list of composite descriptions are available upon request.
12. GIPS® is a registered trademark of CFA Institute. CFA Institute does not endorse or promote this organization, nor does it warrant the accuracy or quality of the content contained herein.
Ratings: The Ratings Distributions are derived by using a weighted average of all credit ratings in the portfolio. The average is calculated by CIM using NRSRO ratings.
*The peer groups were created using the information collected through the PSN investment manager questionnaire and uses only gross of fee returns. PSN Top Guns investment managers must claim that they are GIPs compliant. Products must have an r-squared of 0.80 or greater relative to the style benchmark for the recent five year period. Moreover, products must have returns greater than the style benchmark for the three latest three-year rolling periods. The top ten returns for the latest three-year period then become the TOP GUNS.