

Q3 Market Commentary | In a World of Contradiction
- 5% rates on T-Bills, taxable money market funds, and short-term cash instruments may appear attractive to investors today, however, we are reminded that those yields are almost 50% below the yields investors in the highest tax-brackets can achieve in longer duration tax-free municipal bonds, on a taxable equivalent basis.
- If investors are sufficiently confused by these seemingly contradictory Fed actions and statements, they have a lot of company.
- If we consider what home prices and rent renewals are actually doing today, as opposed to several months ago, we would find that home prices and apartment rental rate increases are barely above zero, according to Cambell Harvey, Professor at Duke University.
- There have been very few occasions, over the past 20 years, when investors could achieve taxable fixed income yields over 5%, or taxable equivalent yields in tax-free municipal bonds, for those in the highest tax bracket, approaching 10%.
- Since 1980, back-to-back years of negative returns of municipal bonds have only occurred once in 1980 and 1981. Yet, the following year, in 1982, the Bloomberg Barclays Municipal Bond Index returned over +40%
The tumult with which financial markets closed the third quarter understandably caught many investors by surprise. While markets began the quarter on stable footing, meaningful declines in public equity markets, together with substantial increases in bond yields, and a corresponding decline in bond prices caused an abrupt and meaningful drawdown in asset values, across asset classes. The Fed paused its rate hiking cycle for the third time in four meetings, indicating concerns that the Fed may have tightened financial conditions too far. Yet, simultaneously, the Fed’s Statement of Economic Conditions (SEP) indicated the Fed was leaving the door open to further rate increases in the future. This is referred to as a “hawkish pause”. The Federal Open Market Committee also removed two rate increases from their 2024 SEP projections in September, suggesting that the Fed believes they will be able to achieve a soft economic landing, avoiding recession, despite having raised interest rates on a trajectory that is among the fastest in US history. If investors are sufficiently confused by these seemingly contradictory Fed actions and statements, they have a lot of company. As professional managers, we too are seeking to navigate the shifting crosscurrents created by the Fed and the corresponding economic impact. The current conflict between market narratives only adds to investor uncertainty.
The contradiction of the Fed’s actions serves to increase market volatility more broadly, challenging one’s ability to divine broad market direction. For example, if the Fed truly believed that inflation remains too high, the job market remains strong, the consumer remains resilient, and the economy is stable, as the recent GDP data have indicated, then why would the Fed be pausing rate hikes for the third time in four meetings? If the Fed truly believed its own statements, one would presume that the Fed would be raising rates much faster and higher, especially if the outcome the Fed fears most, higher inflation, was its base case. We place more emphasis on what action the Fed takes as opposed to what it states through its forward guidance. The Fed’s own economic projections have proven to be horribly inaccurate over time and should not be assumed as fact, in our view. As fixed income investors, we endeavor to look past conflicting statements, seeking greater clarity through the application of deep economic and market research to help guide us on a conservative path that we believe will enable us to navigate challenging market conditions, while remaining focused on our client’s’ long-term investment objectives and risk tolerance.
In this moment, we are reminded that inflation and credit exposure are the greatest risk to long-term fixed income investors. Therefore, investors can take confidence that the future truly is brighter for bond holders, in our view. Inflation has declined markedly from the over 9% Consumer Price Index (CPI) levels that shocked markets in the summer of 2022. The Fed’s 2% inflation target is now within view, given that CPI has declined by almost 70% from its peak. The better news is that the shelter component of CPI, representing roughly one third of the index, was up 7% for September. At first, that may seem concerning, however, Owner’s Equivalent Rent (OER) is a meaningfully lagging indicator. For example, if we consider what home prices and rent renewals are actually doing today, as opposed to several months ago, we would find that home prices and apartment rental rate increases are barely above zero, according to Cambell Harvey, Professor at Duke University, who authored a seminal research paper which identified the positive correlation between the inverted Treasury yield curve and the onset of US recessions, Yield Curve Inversions and Future Economic Growth, May 2008.
Harvey recently noted that, when shelter/OER increases more accurately reflect current market conditions of 1% to 2%, and are substituted into CPI, as opposed to September’s 7% rate, inflation is actually between +1.5% to +2%, in line with the Fed’s stated 2% target. Is it possible that the reason the Fed has paused rate hikes twice in the last three meetings, and is likely to pause for a third time this week, is because they know what we know, that is that the lagged impact of shelter on CPI, will likely result in inflation falling back to the Fed’s goal in the months ahead? Moreover, when we consider that as inflation falls and credit conditions tighten further, due to accelerating real rates, currently at 2.5%, the highest they have been since the Great Financial Crisis, the economy will likely slow much faster. The question remains, what is an investor to do?
Our recommendation to investors is to refocus on long-term investment horizons and objectives while taking from the market what it offers investors today, which are historically high yields. First and foremost, we can definitively state that there have been very few occasions, over the past 20 years, when investors could achieve taxable fixed income yields over 5%, or taxable equivalent yields in tax-free municipal bonds, for those in the highest tax bracket, approaching 10%. See Figure 1 below.
Figure 1
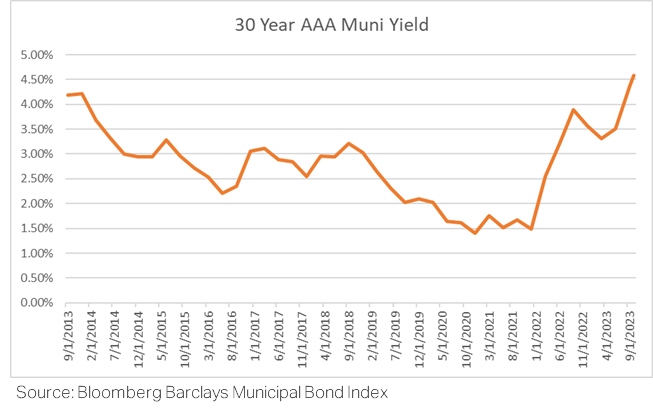
We are now in an environment where high-net-worth investors may be positioned to achieve returns similar to those of the broad equity indices, in the months and years ahead, due to the very attractive tax-free cash flow that municipal bonds deliver, while also enjoying substantially lower standard deviations of returns and lower risk of a 50% drawdown that often accompanies public equity markets, every 10 years or so.
While 5% rates on T-Bills, taxable money market funds, and short-term cash instruments may appear attractive to investors today, however, we are reminded that those yields are almost 50% below the yields investors in the highest tax-brackets can achieve in longer duration tax-free municipal bonds, on a taxable equivalent basis. In addition, given that short-term rates are variable over time, should interest rates fall, investors with large cash positions will be forced to reinvest at substantially lower yields in the future.
While it may not be much comfort to fixed income investors, it is important to note that municipal bonds continue to outperform taxable bonds, year-to-date, falling less in value than their taxable counterparts. Municipal bonds are once again illustrating the stabilizing force they provide, in an investors’ broader asset allocation, especially during difficult market conditions. In our view, municipal bond credit quality remains the strongest it has been in over 30 years, due in large part to record general fund and rainy-day fund balances, as well as the hundreds of billions of dollars they received from President Biden’s American Rescue Plan. We expect the hundreds of billions in cash that municipalities currently hold on their balance sheets will serve to keep municipal credit quality stable as the economy slows in the months to come.
Figure 2
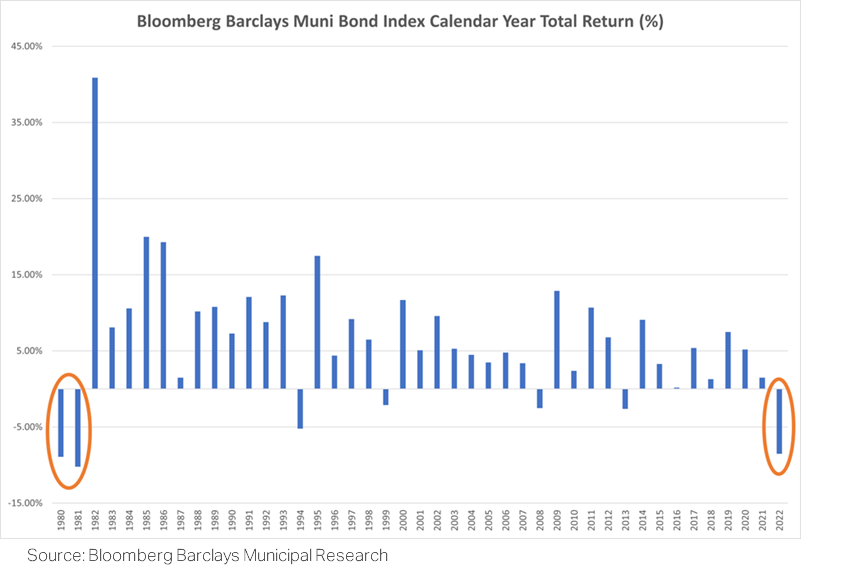
As you can see in Figure 2 above, since 1980, back-to-back years of negative returns of municipal bonds have only occurred once in 1980 and 1981. Yet, the following year, in 1982, the Bloomberg Barclays Municipal Bond Index returned over +40%. We, therefore, are encouraging investors to stay the course, while seeking opportunities to add to their municipal bond positions, as the Fed’s hiking cycle may already have come to a close, meaning the next action by the Fed may actually be a rate cut. Rate cuts have occurred, on average, roughly eight months following a Fed pause, over the history of rate hiking cycles. If you share our view that it is reasonable to expect this outcome once again, interest rates are likely to be materially lower in months ahead. Fixed income investors able to take advantage of the opportunities that persist today, are likely to be well compensated for their courage and patience as economic outcomes unfold in the months and years ahead.
If you should have any questions about this commentary or the municipal bond market more broadly, please let us know.
Best Regards,
Andrew Clinton
CEO
Please remember that past performance may not be indicative of future results. Different types of investments involve varying degrees of risk, and there can be no assurance that the future performance of any specific investment, investment strategy, or product, made reference to directly or indirectly in this newsletter (article), will be profitable, equal any corresponding indicated historical performance level(s), or be suitable for your portfolio. Due to various factors, including changing market conditions, the content may no longer be reflective of current opinions or positions. Moreover, you should not assume that any discussion or information contained in this newsletter (article) serves as the receipt of, or as a substitute for, personalized investment advice from Clinton Investment Management, LLC. To the extent that a reader has any questions regarding the applicability of any specific issue discussed above to his/her individual situation, he/she is encouraged to consult with the professional advisor of his/her choosing. Please consult with an investment professional before making any investment using content or implied content from any investment manager. A copy of our current written disclosure statement discussing our advisory services and fees is available for review upon request.
The views and opinions expressed are not necessarily those of the distributing firm or any affiliates. Nothing discussed or suggested should be construed as permission to supersede or circumvent your firm’s policies, procedures, rules, and guidelines.