Municipal bond investors in the highest tax brackets have an opportunity today to lock in taxable equivalent yields approaching 9%*, compared to taxable corporate bonds. However, this opportunity may be fleeting. Once the Strait of Hormuz is reopened, energy prices are expected to drop, likely easing current inflationary pressures and causing interest rates to fall in the future.
The municipal yield curve is roughly 100 basis points steeper than the current Treasury curve, indicating municipal investors are very well compensated to extend duration.
Where Should Municipal Investors Be Optimally Positioned?
Short duration, passive strategies are likely to continue to underperform, as they have year-to-date and over the past three years, in our view.
Given low absolute yields offered by short-to-intermediate municipal strategies, we believe investors should be underweight 2 to 8 year maturities.
Is Now a Good Time to Add to Municipal Bond Allocations?
Year-to-date municipal new issue supply has been elevated, allowing CIM to expeditiously invest capital and construct new client portfolios effectively.
The timing is ideal to add to municipal bond allocations, in our view, given stable underlying credit fundamentals, high taxable equivalent yields, and ample supply.
We expect new issue municipal bond supply to moderate heading into the summer months, however, creating an attractive entry point today. Materially increased reinvestment dollars and continued strong fund flows are expected to result in fewer compelling relative value opportunities.
Elevated interest rates present investors an opportunity to harvest losses across their municipal bond holdings, positioning portfolios to maximize tax-free cash flow and long-term total return. The tax alpha we may generate for clients complements the total return we have delivered over time.
Why CIM?
CIM’s differentiated municipal bond strategies continue to deliver total returns that are among the highest in the municipal SMA industry for the 12-month period ending April 30, 2026, according to PSN Informa.
This material has been provided for informational purposes only and is not intended by Clinton Investment Management to provide and should not be relied on for tax, legal or accounting advice. If such advice is required, please consult with your own tax, legal and accounting advisors.
Please remember that past performance may not be indicative of future results. Net-of-fee performance returns are calculated by deducting the actual Clinton Investment Management, LLC investment management fee from the gross returns. Performance returns include the reinvestment of income and capital gains. Actual results may differ from the composite results depending upon the size of the account, investment objectives, guidelines and restrictions, inception of the account and other factors. Different types of investments involve varying degrees of risk, and there can be no assurance that the future performance of any specific investment, investment strategy, or product, made reference to directly or indirectly in this newsletter (article), will be profitable, equal any corresponding indicated historical performance level(s), or be suitable for your portfolio. Due to various factors, including changing market conditions, the content may no longer be reflective of current opinions or positions. Moreover, you should not assume that any discussion or information contained in this newsletter (article) serves as the receipt of, or as a substitute for, personalized investment advice from Clinton Investment Management, LLC. To the extent that a reader has any questions regarding the applicability of any specific issue discussed above to his/her individual situation, he/she is encouraged to consult with the professional advisor of his/her choosing. Please consult with an investment professional before making any investment using content or implied content from any investment manager. A copy of our current written disclosure statement discussing our advisory services and fees is available upon request.
The views and opinions expressed are not necessarily those of the distributing firm or any affiliates. Nothing discussed or suggested should be construed as permission to supersede or circumvent your firm’s policies, procedures, rules, and guidelines.
*The taxable equivalent yield (TEY) is calculated by dividing the tax-exempt yield by 1- the maximum federal income tax rate of 40.8% (37% federal + 3.80% NII tax) + the maximum NY income tax rate of 6.85% applicable to a joint filer in the taxable income bracket between $323,201 and $2,155,350 + the NYC Local income tax rate of 3.88%. Taxable income above this bracket will result in a higher TEY.
Unlocking Value: Trading Private Credit’s High Fees, Impaired Liquidity, and Declining Floating Rates for the Tax-Free Certainty and Security of Municipal Bonds
The municipal bond market navigated a turbulent first quarter in 2026, characterized by a “tale of two halves.” While the year began with robust demand and falling yields, a sharp reversal in March, driven by reignited inflation fears and the outbreak of the conflict in the Middle East, erased early gains. Despite this volatility, the fundamental case for municipal bonds has strengthened, particularly as a transparent and liquid alternative to the increasingly opaque private credit market.
Q1 2026 Market Performance and Yield Dynamics
The first two months of 2026 saw municipal bonds off to one of their strongest starts since 2020, with the Bloomberg Municipal Bond Index gaining over 2% through February. However, March brought a significant repricing due to geopolitical strife, with the 10-year tax-exempt benchmark yields, which had bottomed at 2.52% in late February, rising to end the quarter at 3.12% — a 59-basis point jump in a single month, according to the Municipal Market Data AAA muni curve.
Key drivers of the Q1 performance included1:
Technical Conditions: Record issuance in 2025 continued into Q1 2026, with total volume reaching $129.6 billion, up 7% year-over-year.
Resilient Inflows: Despite March’s volatility, tax-exempt mutual funds and ETFs saw nearly $26 billion in net inflows for the quarter, comfortably absorbing supply, illustrating strong retail appetite.
Yield Curve Shifts: The long end of the curve (30-year) became particularly attractive as the Muni/Treasury ratio rose to 91%, the highest level in nearly two years.
The Rising Tide of Local Taxes
In our recent Clinton Investment Jan Commentary, we highlighted a critical and growing risk: the increasing frequency of state and local tax increases across the country. We note that, while state-level credit fundamentals remain generally stable, local municipalities are increasingly choosing to raise income taxes on the wealthy to balance budgets as pandemic-era federal aid is fully exhausted and to address growing unfunded mandates.
We see this trend accelerating, evidenced by tax increase proposals in CA, VA, RI, and ME, together with passage of a 9.9% income tax increase in the state of Washington on those making more than $1 million, effective in 2028. Recently, the state of Illinois began considering a 3% “millionaire’s tax” on high earners.
Munis vs. Private Credit: The Safety and Yield Advantage
As the Federal Reserve continues to cut short-term rates, the landscape for income-seeking investors appears to be shifting away from floating rates, preferred savings, money market funds, and private credit, toward municipal bonds.
The Decline of Private Credit
Private credit, once the darling of the “yield at any cost” era, is facing significant headwinds in 2026.
Fee and Liquidity Burdens: Private credit funds often charge high management and performance fees (e.g., 2% and 20%) and frequently utilize “lock-ups” and “gates” that prevent investors from freely accessing their capital during market stress, as is occurring with increasing frequency in the current environment, evidenced by the plethora of news articles referencing funds implementing these tactics.
Floating Rate Risk: Most private credit loans are floating rate. As the Fed cuts rates, the yields on these loans will naturally decline, potentially eroding the income profile that attracted investors initially.
Default Concerns: A recent quote from Fitch Ratingshighlights the rising fragility in this sector, estimating a private credit default rate of roughly 6%.2 By contrast, municipal bond default rates remain historically below 1%, according to Moody’s.3
The Taxable Equivalent Yield (TEY) Calculation
Municipal bonds currently offer a compelling alternative to private credit and other taxable fixed income instruments. with TEY’s of 8% to 9% for those in the highest tax bracket, seeking protection from federal, state, and local taxes. For example, if a long-term muni bond offers a 5.00% tax-free yield (as seen recently in the 20-30 year area of the curve for NY), the TEY is approximately 8.45%.4
The visualization above illustrates how a base tax-free yield of 5.00% scales as the investor’s tax burden increases. In high-tax states like New York or California, the TEY can easily surpass 9.5% when accounting for both federal and state exemptions.
Conclusion
The first quarter of 2026 reaffirmed that while municipal bonds are not immune to interest rate volatility, they have historically been, and we believe will remain, among the most resilient and sound investments for high-income investors. When one considers the rising pressure to raise state and local taxes, especially on high-income earners, together with the rising default concerns, high fees, and declining floating rate yields in private credit, municipal bonds remain a compelling alternative given their return profile, credit stability and higher level of liquidity they offer investors.
This material has been provided for informational purposes only and is not intended by Clinton Investment Management to provide and should not be relied on for tax, legal or accounting advice. If such advice is required, please consult with your own tax, legal and accounting advisors.
Please remember that past performance may not be indicative of future results. Net-of-fee performance returns are calculated by deducting the actual Clinton Investment Management, LLC investment management fee from the gross returns. Performance returns include the reinvestment of income and capital gains. Actual results may differ from the composite results depending upon the size of the account, investment objectives, guidelines and restrictions, inception of the account and other factors. Different types of investments involve varying degrees of risk, and there can be no assurance that the future performance of any specific investment, investment strategy, or product, made reference to directly or indirectly in this newsletter (article), will be profitable, equal any corresponding indicated historical performance level(s), or be suitable for your portfolio. Due to various factors, including changing market conditions, the content may no longer be reflective of current opinions or positions. Moreover, you should not assume that any discussion or information contained in this newsletter (article) serves as the receipt of, or as a substitute for, personalized investment advice from Clinton Investment Management, LLC. To the extent that a reader has any questions regarding the applicability of any specific issue discussed above to his/her individual situation, he/she is encouraged to consult with the professional advisor of his/her choosing. Please consult with an investment professional before making any investment using content or implied content from any investment manager. A copy of our current written disclosure statement discussing our advisory services and fees is available upon request.
The views and opinions expressed are not necessarily those of the distributing firm or any affiliates. Nothing discussed or suggested should be construed as permission to supersede or circumvent your firm’s policies, procedures, rules, and guidelines.
1Source: Municipal Securities Rule Making Board
2Fitch: U.S. Private Credit Default Rate Continues Upward March to 5.8% in January 2026
4The taxable equivalent yield is calculated by dividing the tax-exempt yield by 1- the maximum federal income tax rate of 40.8% (37% federal + 3.8% NII tax).
Clinton Investment Management (CIM) calculates tax alpha as the capital losses harvested, divided by the market value of the assets under management, multiplied by the maximum capital gains tax rate of 23.8% (20% plus 3.8% net investment income tax), for a given period. In essence, the tax alpha we generate is the amount our clients save, annually in taxes, that they would have been forced to pay otherwise, assuming they have gains to offset each year*.
In a dynamic environment increasingly focused on tax efficiency, the definition of “Tax Alpha” is essential to understanding the actual value a given muni manager delivers. To this point, what many managers say and what they do may not necessarily be the same thing. For example, quantifying the amount of losses harvested, as many managers do, is not Tax Alpha. Rather, Tax Alpha is the amount of capital gain avoided. A manager who states only the amount of losses harvested may be significantly overstating the actual Tax Alpha they achieved.
Is Your Current Muni SMA Manager Willing to Document Their Tax Alpha Generation?
Marketing literature from several prominent municipal bond industry peers claim to actively harvest tax losses within their Separately Managed Account (SMA) municipal bond portfolios but you are unlikely to find this data documented anywhere. Beyond this fact, many of these managers outline minimum thresholds for net benefits to be realized for their client portfolios, (benefits net of transaction costs), before engaging in tax harvesting, limiting the degree to which they ultimately deliver on this promise.
We would strongly encourage investors and advisors to challenge municipal bond managers who make ambitious claims regarding tax-loss harvesting, if they are unwilling to document the actual Tax Alpha they claim to deliver. If managers will not document, in their marketing literature, the tax alpha they generated, what they say and ultimately do may not be the same thing.
Where Can I See CIM’s Composite Level Tax Alpha Generation?
You can find our Tax Alpha on the front page of our strategy fact sheets. CIM prominently and transparently displays the Tax Alpha we generate on our SMA strategy fact sheets, whereas competitors may simply claim, in casual conversation, losses they generate on a theoretical, rather than documented basis. For example, the 2025 year-end tax alpha for our Municipal Credit Opportunities strategy composite, with over $2.6 billion in assets under management, was 36 basis points. This net tax benefit proportionately offset the annual management fee we charge.
What is CIM’s Tax Loss Harvesting Philosophy?
At CIM, tax harvesting is deeply embedded in our investment protocols and actions. We proactively engage in tax swaps throughout the year. This contrasts with the approach that may be taken by peers who may delay such actions until they are forced, by the advisor or the client, to do so, or they wait until the final few weeks of the calendar year, when secondary market liquidity and depth are typically more limited. CIM’s active Tax Optimization Protocol (TOP) has generated meaningful tax alpha for clients over the past five years, while also preserving core portfolio characteristics and objectives.
CIM also seeks to avoid common pitfalls associated with tax loss harvesting, such as selecting problematic or ineligible replacement securities, holding bond sale proceeds in cash for extended periods, or ignoring transaction and opportunity costs associated with these swaps.
This material has been provided for informational purposes only and is not intended by Clinton Investment Management to provide and should not be relied on for tax, legal or accounting advice. If such advice is required, please consult with your own tax, legal and accounting advisors.
Please remember that past performance may not be indicative of future results. Net-of-fee performance returns are calculated by deducting the actual Clinton Investment Management, LLC investment management fee from the gross returns. Performance returns include the reinvestment of income and capital gains. Actual results may differ from the composite results depending upon the size of the account, investment objectives, guidelines and restrictions, inception of the account and other factors. Different types of investments involve varying degrees of risk, and there can be no assurance that the future performance of any specific investment, investment strategy, or product, made reference to directly or indirectly in this newsletter (article), will be profitable, equal any corresponding indicated historical performance level(s), or be suitable for your portfolio. Due to various factors, including changing market conditions, the content may no longer be reflective of current opinions or positions. Moreover, you should not assume that any discussion or information contained in this newsletter (article) serves as the receipt of, or as a substitute for, personalized investment advice from Clinton Investment Management, LLC. To the extent that a reader has any questions regarding the applicability of any specific issue discussed above to his/her individual situation, he/she is encouraged to consult with the professional advisor of his/her choosing. Please consult with an investment professional before making any investment using content or implied content from any investment manager. A copy of our current written disclosure statement discussing our advisory services and fees is available upon request.
The views and opinions expressed are not necessarily those of the distributing firm or any affiliates. Nothing discussed or suggested should be construed as permission to supersede or circumvent your firm’s policies, procedures, rules, and guidelines.
* Tax-loss harvesting is any transaction resulting in a capital loss. Although realized capital losses can potentially offset capital gains, reduce taxes paid, and enhance after-tax returns, individual results will vary dependent upon an investor’s actual tax rates, the presence of current or future capital loss carry forwards, and other investor specific tax circumstances. Tax-loss harvesting may not achieve actual value creation.
In January 2025 several wildfires burned in the Los Angeles area resulting in catastrophic destruction and loss of life for which the causes are still under investigation and aftermath yet to be determined. The frequency and scale of wildfires and weather-related incidents have materially increased over the last decade, and continues to do so, thus increasing the risks and potential liabilities for utilities requiring an augmented approach to assessing credit risk. This is especially the case in California where utilities operate under a strict liability standard known as “inverse condemnation” that can potentially lead to a material increase in liability exposure if the utilities’ equipment is implicated in the cause of a fire. This standard was unfortunately illustrated in 2019 with the Pacific Gas & Electric (for-profit utility) bankruptcy as a result of the Camp Fires in 20181.
Our investment process is predicated on identifying risks and receiving adequate compensation for that risk. While we do share the view that the Los Angeles Department of Water & Power (and related entities) is a systemically important issuer as the largest municipal utility in the country, with access to liquidity and potential support from the state. We do not, however, have any clarity, nor does anyone else, on the magnitude of their potential liability from the 2025 fires and the resulting impact to their credit rating. Due to insatiable demand for California municipal bonds given the state’s high taxes, many California issuers are issuing bonds that, despite having credit ratings inferior to AAA national rates, are yielding below those of AAA quality, effectively receiving a subsidy from investors. Or stated another way, investors may not be adequately compensated for the increased credit risks they are bearing. Illustrative of this is Los Angeles Department of Water & Power (AA-, Aa2, A) which in December 2024 offered yields on par with national AAA bonds2 though their credit rating was 5 notches lower. Spreads widened by +50-60 basis points following the wildfires in January 2025 and began on a path lower to +35 by October, and most recently to +20 basis points as a new issue of power revenue bonds were brought to market last month3.
As investors appear to be willing to accept such nominal compensation for an unknown risk, we ask why? Especially when there are alternatives, in-state and out of state (on an after-state tax basis), that provide comparable or greater yields. Even the rating agencies affirming ratings acknowledge the outcome of litigation pertaining to Los Angeles Department of Water & Power’s culpability in contributing to the progression of the fires and subsequent damage, are an unknown. If found liable, these losses could be quite material for the entity and perhaps damaging to ratings. This could cause potential spread widening given these aforementioned risks do not appear to be adequately factored into current prices.
“Los Angeles wildfires bring wider spreads, downgrade for DWP”, The Bond Buyer, January 14, 2025 ↩︎
“Los Angeles DWP pricing gains traction after wildfire”, The Bond Buyer, January 27, 2026 ↩︎
Munis have now delivered solid returns, for the past three consecutive years, resulting in over +13% returns cumulatively, or +4.00% annually, as of 1/19/26, according to the Bloomberg Muni Index.
Municipal bonds delivered performance that was higher, on a taxable equivalent basis, than every other fixed income market in 2025, including Treasury bonds, corporate bonds, high yield bonds, and global bonds, according to Bloomberg Municipal Bond Index, as of 1/19/26.
There are now almost a dozen states considering raising income or surtaxes on taxpayers, including individuals making more than $1 million.
We say to those in the highest tax brackets, just because you are paranoid doesn’t mean they aren’t after you.
Holders of cash and short duration instruments are giving up the opportunity to increase their tax-free cash flow by 100%, as the yield differential between short and long-term municipal bonds is now over 2.00% or 200 basis points, more than double the yield of short-term bonds and after-tax taxable cash yields.
Municipal bond investors willing to extend out to modestly longer maturities can achieve taxable equivalent yields approaching 7%.
The casual market observer is forgiven if, in early 2025, they concluded it would be an underwhelming year for municipal bond returns. If you close one eye and look at the first half of 2025 in isolation, that summation would have appeared reasonable. However, for those with an investment horizon longer than six months, you would have also seen the second half of 2025 deliver one of the most powerful recoveries in municipal bond prices in some time. As our clients and loyal followers know, we have been imploring investors to prepare for a turnaround in market sentiment, for a number of quarters. We remained firm in our conviction that a recovery in municipal bond performance would likely be swift and powerful. In the early days of 2026, we reflect not only on market conditions that have brought us to this point but also contemplate the various risks and opportunities investors are likely to experience in 2026.
Market conditions in the first half of 2025 were indeed challenging. The municipal bond market stumbled out of the gate, plagued by uncertainty surrounding the potential loss of municipal bonds’ coveted tax-exempt status. Fear of losing the municipal bond tax-exemption has become the proverbial Sword of Damocles, hanging over the muni market, for over three decades. While the risk of losing tax-exempt status is perceived to be quite low, for constitutional reasons, as we discussed extensively in our Q1 2025 Market Commentary Shaken, it has not stopped retail investors from overreacting each time the topic begins to leak into media headlines. The mere whisper of the potential loss of muni tax-exemption gets the financial news printing presses humming. The media and the broader financial services industry understand all too well that there is no better way to alarm wealthy, tax sensitive, retail investors, in an effort to capture their breathless attention, than to suggest that one of the last and purest tax shelters available may be taken away. Nonetheless, once the news broke that the One Big Beautiful Bill Act (OBBBA) had passed and the muni tax-exemption had been preserved, retail nerves settled as quickly as they had previously risen. Investors took stock of the relative cheapness of the municipal asset class more broadly and wisely concluded that munis were simply too attractive to ignore, igniting the recovery and rally that ensued in the latter part of 2025, which has continued into 2026.
What started off as a spiritless year for munis, ended on a particularly strong note. Munis have now delivered solid returns, for the past three consecutive years, resulting in over +13% returns cumulatively, or +4.00% annually, as of 1/19/26, according to the Bloomberg Muni Index. Some may also be surprised to learn that municipal bonds delivered performance that was higher, on a taxable equivalent basis, than every other fixed income market in 2025, including Treasury bonds, corporate bonds, high yield bonds, and global bonds, according to Bloomberg Municipal Bond Index, as of 1/19/26.
While this may come as a shock to some, it is a reminder of how frequently investors fail to properly measure and appreciate the full value of the tax-free income that municipal bonds deliver. The challenge for investors is that municipal bond returns are almost always quoted on an after-tax basis, that is returns are not “grossed up” to reflect the tax-free income they generate, while taxable markets, bonds and equities, almost always quote returns on a before-tax basis. We frequently remind investors, to achieve a true apples-to-apples comparison of their investments, they must carefully calculate the “taxable equivalent” yield and return of their municipal bond holdings when comparing with taxable alternatives. We understand that not everyone enjoys pouring over statements, performing mathematical equations. However, not doing so can result in lost performance and/or unnecessarily increased risk exposures.
Just Because You’re Paranoid Doesn’t Mean They Aren’t After You
Despite the passage of the OBBBA, we know that taxes more broadly will likely remain roughly the same for most taxpayers across the country. Yet, taxes may actually be rising for many wealthy investors, depending on where they live. There are now almost a dozen states considering raising income or surtaxes on taxpayers, including indviduals making more than $1 million. A number of states are also considering additional wealth taxes, i.e. California. We believe these initiatives are the clearest indication that state and local governments are planning to increase revenue rather than reduce spending, as they face the reality of billions of dollars in budgets deficits. While this may be bad news for taxpayers, it is welcome news for municipal bond holders, as we expect municipal credit quality to remain stable going forward. Our confidence is tied to the knowledge that municipalities have the authority and, in several instances, a willingness to raise revenues though higher taxes and user fees to fund debt service and future expenditures. This new reality speaks directly to the power of tax-free cash flow and will likely mean that the tax-exempt income municipal bonds deliver will increase in value as we look to a future of higher local taxes, even if Federal income tax rates remain roughly the same. Therefore, we say to those in the highest tax brackets, just because you are paranoid doesn’t mean they aren’t after you.
Risks Seen and Unseen
We continue to believe that the greatest risk facing fixed income investors going forward remains reinvestment rate risk. The very high opportunity cost of investor exposures to cash, preferred savings, and short duration instruments is evident in the current slope of the yield curve, see Figure 1 below.
The ‘AAA’, tax-free municipal bond and taxable Treasury curves illustrate clearly the meaningfully positive slope of the curve. As you can see, the additional yield investors receive for investing in longer, rather than short, duration bonds is significant. Investors with heavy exposures to preferred savings, cash, and short duration bonds, may be unaware that the lower yield and income they now receive translates into a significant loss of cash flow going forward. This is a relatively new experience for investors as short-term rates were quite high just two years ago. For example, holders of cash and short duration instruments are giving up the opportunity to increase their tax-free cash flow by 100%, as the yield differential between short and long-term municipal bonds is now over 2.00% or 200 basis points, more than double the yield of short-term bonds and after-tax taxable cash yields.
Why Inflation Isn’t Rising
As we consider the factors that have put downward pressure on interest rates over the past two years, we expect many of those conditions to persist in 2026 as well. Inflation was a popular talking point throughout 2025. We continue to believe any pressure from increased tariffs is likely to be temporary, as we do not expect the current administration to materially increase tariffs yet again in 2026. Therefore, the modest price increases that may have flowed through to prices of goods and services, due to tariffs, are likely to diminish as base effect comparisons improve going forward. Owners’ Equivalent Rent (OER), which represents roughly a third of the US Consumer Price Index (CPI), fell consistently throughout 2025. We expect declines in residential and commercial real estate values to continue in 2026, exerting further downward pressure on OER. Therefore, we expect CPI to continue to moderate going forward. As inflation falls, real returns (that is return after inflation) of fixed cash flow rises. For example, municipal bond investors willing to extend out to modestly longer maturities can achieve taxable equivalent yields approaching 7%. Assuming CPI averages approximately 2.70% during 2026, as it did in 2025, the real, inflation-adjusted yield that muni investors could achieve would be over +4.2%, on a net basis. For this reason, we continue to believe that municipal bonds, given their superior taxable equivalent yields and risk adjusted return potential, are among the most compelling investments investors, in the highest tax brackets, can make in 2026.
CIM Investment Management News
We are very pleased to share that 2025 was another powerful year of growth for CIM. We added new team members and continued to meaningfully grow our assets under management, as evidenced by the roughly $900 million inflows into our strategies in 2025. We are grateful for the ongoing trust and loyalty of the clients and advisors we serve. We are also fully aware that our success would not be possible without the dedication, commitment, and strength that each CIM team member delivers to our clients each day. We would like to express our deepest thanks to all of our partners and look forward to another year of growth in 2026.
Should you have any questions about this commentary or where we are seeing the best opportunities in the municipal bond market today, please do not hesitate to reach out.
Sincerely,
Andrew Clinton
CEO
*The taxable equivalent yield represents the yield that must be earned on a fully taxable investment in order to equal the tax-exempt yield of the composite. The taxable equivalent yield is calculated by dividing the tax-exempt yield by 1- the maximum federal income tax rate of 40.8% (37% federal + 3.8% NII tax).
This material has been provided for informational purposes only and is not intended by Clinton Investment Management to provide and should not be relied on for tax, legal or accounting advice. If such advice is required, please consult with your own tax, legal and accounting advisors.
Please remember that past performance may not be indicative of future results. Net-of-fee performance returns are calculated by deducting the actual Clinton Investment Management, LLC investment management fee from the gross returns. Performance returns include the reinvestment of income and capital gains. Actual results may differ from the composite results depending upon the size of the account, investment objectives, guidelines and restrictions, inception of the account and other factors. Different types of investments involve varying degrees of risk, and there can be no assurance that the future performance of any specific investment, investment strategy, or product, made reference to directly or indirectly in this newsletter (article), will be profitable, equal any corresponding indicated historical performance level(s), or be suitable for your portfolio. Due to various factors, including changing market conditions, the content may no longer be reflective of current opinions or positions. Moreover, you should not assume that any discussion or information contained in this newsletter (article) serves as the receipt of, or as a substitute for, personalized investment advice from Clinton Investment Management, LLC. To the extent that a reader has any questions regarding the applicability of any specific issue discussed above to his/her individual situation, he/she is encouraged to consult with the professional advisor of his/her choosing. Please consult with an investment professional before making any investment using content or implied content from any investment manager. A copy of our current written disclosure statement discussing our advisory services and fees is available upon request.
The views and opinions expressed are not necessarily those of the distributing firm or any affiliates. Nothing discussed or suggested should be construed as permission to supersede or circumvent your firm’s policies, procedures, rules, and guidelines.
We are very proud to share that a highly valued member of the Clinton Investment Management team, Alexander Clinton, has been bestowed with Smith’s Research & Gradings 2025 Rising All-Star Municipal Analysts Award. This honor recognizes individuals for outstanding contributions to and achievements within the municipal bond investment community.
Alex, working alongside Shivani Singh, Head of Credit Research, is a core member of our research team and his professional integrity, diligence, attention to detail, and ability to correlate and connect dots in a broader credit perspective is impressive. This award recognizes his hard work, talent, and perseverance, creating significant value for our clients.
Congratulations to Alex for earning this prestigious award!
The municipal bond market is enjoying its third consecutive year of meaningfully positive total return, 12% on a cumulative basis, since 2023. CIM’s strategies have delivered meaningfully higher returns both net-of-fees and after taxes.
Municipal bond total returns for the combined period of September through October 2025 were the highest in over 30 years.
Long duration municipal bonds have outperformed short duration munis by roughly +6.00%, or +600 basis points, since September 1st.
Municipal bond TEY’s now exceed nearly every other fixed-income asset class, according to Morgan Stanley Research.
Consistent with our expectations, moderate inflation and weakening labor market conditions have driven the Fed to restart its easing cycle, cutting interest rates twice with more cuts expected in the near-term.
Our strategies offer yields between 6% and 7%, on a TEY basis for those in the highest tax bracket, thereby meaningfully compensating investors to swap out of low yield, low return short duration cash and passive bond strategies.
High-net-worth investors with exposure to Treasury bond ladders would also benefit from transitioning to municipal bonds, given the meaningful yield decline we have seen in short-term Treasury bonds and the higher taxable equivalent yields municipal bonds offer.
We remain constructive on the outlook for the municipal bond market through the end of 2025 and into 2026.
As we approach the close of the fourth quarter and the Thanksgiving holiday, this time of year presents an opportunity to reflect on events of the past several months and the impact of our decisions on achieving our individual and collective long-term goals and objectives. CIM would also like to express our sincerest gratitude to the clients and advisors we serve for their ongoing trust, confidence, and loyalty. We take our role as responsible stewards of our client’s wealth extremely seriously. For this reason, we are deeply grateful for the value we have delivered throughout 2025, despite yet another tumultuous period in the financial markets. As we evaluate events of this past year, we also carefully consider the risks that lie before us.
While the year is not yet over, it may come as surprise to some that the municipal bond market is enjoying its third consecutive year of meaningfully positive total return, 12% on a cumulative basis, since 2023, according to the Bloomberg Municipal Bond Index. CIM’s strategies have delivered meaningfully higher returns both net-of-fees and after taxes. For example, our Municipal Credit Opportunities and Municipal Market Duration strategies have delivered over +17% and +15% respectively, net-of-fees on a cumulative basis, over the aforementioned period. This was not the case just a few months ago, as the first seven months of the year were decidedly weak for the municipal bond market. This caused some short-term investors in the muni market to become disenchanted with returns they had achieved. Some were even motivated to liquidate the entirety of their municipal holdings, selling longer-term bonds to invest in short duration paper or cash. Unfortunately, for those investors, this rash decision was ill-timed as they missed out on one of the strongest rallies in the history of the municipal bond market at end of the third quarter. For example, long duration municipal bonds have outperformed short duration munis by roughly +6.00%, or +600 basis points, since September 1st, 2025, according to Barclays Municipal Research. Municipal bond total returns for the combined period of September through October 2025 were the highest in over 30 years. The surge in municipal bond prices over the past several weeks has transformed an otherwise lackluster year of returns into a decidedly solid year for the muni market and our strategies in particular.
There is significantly more room for longer duration munis to run, in our view. This is partly due to the relatively high yields one can still achieve in municipal bonds that are exempt from Federal and, in many instances, state income taxes. This tax-exemption is powerful, as a tax-free return of 4.00% translates to a taxable equivalent yield (TEY)* of +6.80% annually, for those in the highest federal tax-bracket. When we consider the substantially lower risk that municipal bonds carry, the diversifying force municipal bonds provide in one’s asset allocation becomes apparent. Municipal bond TEY’s now exceed nearly every other fixed-income asset class, according to Morgan Stanley Research, see Figure 1 below.
We deeply appreciate our clients’ patience and conviction in the fundamental macroeconomic view we shared many months ago. We know the first half of the year was a challenging period for many investors. This experience is yet another reminder that a patient, measured, and calm approach to investing and assessing one’s return experience is essential, given the degree of short-term volatility the exists in markets today. Our disciplined approach to portfolio construction and positioning is reflected in our long-held views on the direction of the US economy and expressed in our portfolios, enabling our clients to participate fully in the municipal bond market rally of the past two months.
Consistent with our expectations, moderate inflation and weakening labor market conditions have driven the Fed to restart its easing cycle, cutting interest rates twice with more cuts expected in the near-term. For this reason, we believe investors who remain largely underweight fixed income, and municipal bonds in particular, should consider increasing their municipal bond holdings to lock in higher yields before rates fall further. Most savings rates and money market funds have now fallen well below the important 4.00% taxable yield threshold. Our strategies offer yields between 6% and 7%, on a TEY basis for those in the highest tax bracket, thereby meaningfully compensating investors to swap out of low yield, low return short duration cash and passive bond strategies. High-net-worth investors with exposure to Treasury bond ladders would also benefit from transitioning to municipal bonds, given the meaningful yield decline we have seen in short-term Treasury bonds and the higher taxable equivalent yields municipal bonds offer.
As investors consider the most appropriate asset allocations to help navigate rising uncertainty, driven by extreme valuations on risk assets, we understand some investors may compare the returns of the high-flying S&P 500 to the returns municipal bonds have delivered over the past few years. We would caution against this comparison. The highly volatile S&P 500 is demonstrably different than high quality, stable, and durable municipal bonds. As such, munis should not be expected to deliver a similar return experience. The S&P 500 carries dramatically higher risk, roughly 400% more risk, as measured by the S&P 500’s ten-year standard deviation of return of approximately 16%. On the contrary, municipal bonds play a vastly different role in an investor’s asset allocation. Municipal bonds, by definition, offer investors stable cash flow and safety of principal, providing consistent competitive tax-free cash flow while also preserving the wealth investors have accumulated through hard work and discipline, often across generations.
What lies ahead?
We have good news to share. We expect municipal bond fundamental credit quality to remain stable going forward. Moreover, CIM’s demonstrated ability to identify and select stable-to-improving issuers, as illustrated by our long-term track record of success, provides confidence to investors seeking to successfully leverage the opportunity to moderately move down in credit quality to meaningfully increase yield, without materially amplifying credit risk. We know with certainty that we don’t know what lies ahead. Market conditions and public policy shifts serve as stark reminders that risk persists regardless of how much some in the investing community would like us to ignore it. For this reason, we believe investors will continue to seek out lower risk, higher yielding instruments. Therefore, we remain constructive on the outlook for the municipal bond market through the end of 2025 and into 2026. Technical market conditions that existed during the first half of the year have begun to dissipate, as evidenced by the outperformance of the municipal bond market in recent months. As we approach year-end, the expected decline in new issuance and elevated yields investors can still achieve on longer duration municipal bonds will likely continue to attract investor inflows supporting municipal bond performance in the months ahead.
Should you have any questions regarding the municipal bond market or this commentary, please do not hesitate to reach out.
Sincerely,
Andrew Clinton
CEO
*The taxable equivalent yield represents the yield that must be earned on a fully taxable investment in order to equal the tax-exempt yield of the composite. The taxable equivalent yield is calculated by dividing the tax-exempt yield by 1- the maximum federal income tax rate of 40.8% (37% federal + 3.8% NII tax).
This material has been provided for informational purposes only and is not intended by Clinton Investment Management to provide and should not be relied on for tax, legal or accounting advice. If such advice is required, please consult with your own tax, legal and accounting advisors.
Please remember that past performance may not be indicative of future results. Net-of-fee performance returns are calculated by deducting the actual Clinton Investment Management, LLC investment management fee from the gross returns. Performance returns include the reinvestment of income and capital gains. Actual results may differ from the composite results depending upon the size of the account, investment objectives, guidelines and restrictions, inception of the account and other factors. Different types of investments involve varying degrees of risk, and there can be no assurance that the future performance of any specific investment, investment strategy, or product, made reference to directly or indirectly in this newsletter (article), will be profitable, equal any corresponding indicated historical performance level(s), or be suitable for your portfolio. Due to various factors, including changing market conditions, the content may no longer be reflective of current opinions or positions. Moreover, you should not assume that any discussion or information contained in this newsletter (article) serves as the receipt of, or as a substitute for, personalized investment advice from Clinton Investment Management, LLC. To the extent that a reader has any questions regarding the applicability of any specific issue discussed above to his/her individual situation, he/she is encouraged to consult with the professional advisor of his/her choosing. Please consult with an investment professional before making any investment using content or implied content from any investment manager. A copy of our current written disclosure statement discussing our advisory services and fees is available upon request.
The views and opinions expressed are not necessarily those of the distributing firm or any affiliates. Nothing discussed or suggested should be construed as permission to supersede or circumvent your firm’s policies, procedures, rules, and guidelines.
Muni tax loss harvesting and opportunity to deliver tax alpha in the first 9 months was successful for our clients, as CIM has delivered over 0.30%, 30 basis points of tax alpha year-to-date. *
The positive narrative shift and constructive outlook for the municipal bond market has resulted in the best total return for October in over 30 years.
The scale of the opportunity in longer duration municipal bonds persists, as munis with longer maturities remain one to two z-scores/standard deviations cheap to corporates, indicating the scale of the opportunity for municipal bonds to continue outperforming.
As we expected, the Fed has resumed cutting interest rates due to considerable weakening in the labor market and subdued inflation, despite tariff effects.
Investors with large exposures to passive, short duration bonds and preferred savings are likely to experience significantly reduced cash flow, as short-term rates fall further and reinvestment opportunities dwindle.
Munis continue to offer some of the highest returns, on an after-tax basis from an income perspective, compared to other fixed income alternatives.
Our strategies, with an average credit quality of AA/A, are targeting taxable equivalent yields of 7% to over 8%, assuming an individual is in the highest tax bracket and a resident of high tax states like NY or CA.** Broader municipal sector credit fundamentals remain resilient notwithstanding a slowdown in the economy.
Municipal bond defaults are rare and sector default rates are strikingly lower than their corporate peers.
Expected further declines in CPI in 2026, as base effects of tariffs fade, appear not to be priced into fixed income markets.
Technical conditions have historically had an outsized impact on municipal bond returns. Muni technicals have turned significantly positive in recent weeks as demand, in the form of asset class inflows into municipal bond mutual funds, have accelerated since September as supply has fallen by over 58% since 10/16/25.
*CIM defines Tax Alpha as the potential value created through tax-loss harvesting techniques that fully offset a capital gain and is derived by calculating the composite capital losses divided by the average composite assets and multiplied by the maximum capital gains tax rate of 23.8% (20% plus 3.8% Net Investment Income Tax), for any stated period. Tax-loss harvesting is any transaction resulting in a capital loss. Although realized capital losses can potentially offset capital gains, reduce taxes paid, and enhance after-tax returns, individual results will vary dependent upon an investor’s actual tax rates, the presence of current or future capital loss carry forwards, and other investor specific tax circumstances. Tax-loss harvesting may not achieve actual value creation.
**The taxable equivalent yield represents the yield that must be earned on a fully taxable investment in order to equal the tax-exempt yield of the composite. The taxable equivalent yield is calculated by dividing the tax-exempt yield by 1- the maximum federal income tax rate of 40.8% (37% federal + 3.8% NII tax). For CA the calculation includes the addition of a maximum state tax rate of 13.30%. For NY the calculation includes the addition of a maximum state tax rate of 9.65% applicable to a single filer in the taxable income bracket between $1,077.551 and $5,000,000.
This material has been provided for informational purposes only and is not intended by Clinton Investment Management to provide and should not be relied on for tax, legal or accounting advice. If such advice is required, please consult with your own tax, legal and accounting advisors.
Please remember that past performance may not be indicative of future results. Net-of-fee performance returns are calculated by deducting the actual Clinton Investment Management, LLC investment management fee from the gross returns. Performance returns include the reinvestment of income and capital gains. Actual results may differ from the composite results depending upon the size of the account, investment objectives, guidelines and restrictions, inception of the account and other factors. Different types of investments involve varying degrees of risk, and there can be no assurance that the future performance of any specific investment, investment strategy, or product, made reference to directly or indirectly in this newsletter (article), will be profitable, equal any corresponding indicated historical performance level(s), or be suitable for your portfolio. Due to various factors, including changing market conditions, the content may no longer be reflective of current opinions or positions. Moreover, you should not assume that any discussion or information contained in this newsletter (article) serves as the receipt of, or as a substitute for, personalized investment advice from Clinton Investment Management, LLC. To the extent that a reader has any questions regarding the applicability of any specific issue discussed above to his/her individual situation, he/she is encouraged to consult with the professional advisor of his/her choosing. Please consult with an investment professional before making any investment using content or implied content from any investment manager. A copy of our current written disclosure statement discussing our advisory services and fees is available upon request.
The views and opinions expressed are not necessarily those of the distributing firm or any affiliates. Nothing discussed or suggested should be construed as permission to supersede or circumvent your firm’s policies, procedures, rules, and guidelines.
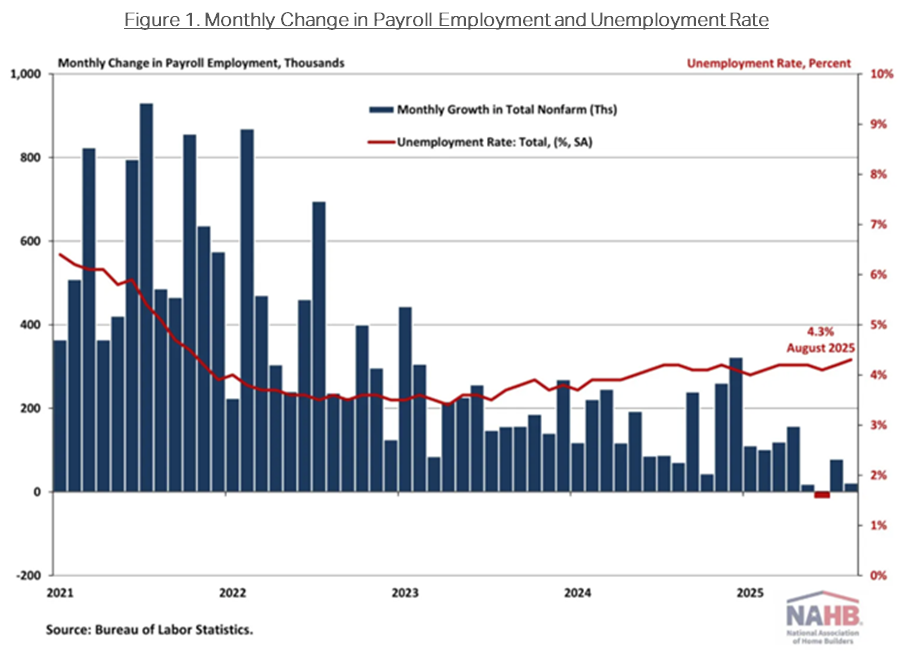
The recent Bureau of Labor Statistics (BLS) payroll revision showing downward revisions of a record 911,000 jobs in the year through March 2025, further demonstrates the weakness of the current job market.
The Consumer Price Index (CPI) peaked at 9.1% in 2022 and has since fallen by over 68% to 2.86%, as of August 2025.
An average of less than 30,000 jobs per month has been created over the past three months.
The Fed’s caution, while understandable given the uncertainty surrounding public policy and global macroeconomic conditions, has further dampened economic growth, which will likely require the Fed to reduce interest rates more.
The muni curve slope is now more than double the +120 bps of the US Treasury curve slope, further illustrating the relative cheapness of the longer duration munis.
No, interest rates are not rising.
We would recommend extending duration to lock in higher yields for the long term.
Since the launch of the Fed easing cycle in September 2024, some have claimed that the Fed was cutting interest rates for the “right” reasons. The persistent view was that the economy had grown rapidly during the three years following the pandemic. Therefore, an eventual slowdown in GDP growth was to be expected. Some believed that the Fed’s decision to begin cutting rates in September 2024 was not a harbinger of weaker economic growth and deteriorating employment environment, rather, it was a “normalization” of interest rates to a level that was better suited to a slower growth environment. The Fed’s decision to begin cutting the Federal Funds rate was seen as a minor adjustment, necessary to better align financial conditions with a more stable, albeit slower, economic growth trajectory.
Conversely, our contention has been that the Fed’s decision was, in fact, the launch of a necessary easing cycle, with the goal of forestalling further declines in GDP growth and arresting the decline of what appeared to be a weakening labor force. Our view remains that the Fed did not embark on a path of rate cuts to simply normalize market conditions. We firmly believe the Fed foresaw increasing risks of further economic deceleration and its impact on unemployment, which is why they were compelled to act. We now see the Fed’s actions were not only warranted, but also insufficient, given the downward trajectory of economic conditions and US payrolls that are now evident, as illustrated by last Friday’s extremely weak payroll report, see Figure 1. The recent Bureau of Labor Statistics (BLS) payroll revision showing downward revisions of a record 911,000 jobs in the year through March 2025, further demonstrates the weakness of the current job market.
The Fed’s dual mandates of stable prices and maximum employment have been in tension for some time. While inflation has fallen dramatically since its peak in 2022, job gains, until this year, appeared to be stable. The Consumer Price Index (CPI) peaked at 9.1% in 2022 and has since fallen by over 68% to 2.86%, as of August 2025. The Fed’s stated goal of 2.00% inflation is now within reach, yet some remain fearful that upward pressure from tariffs could cause a reversal in this multi-year, downward trend in CPI. It is important to note that we are not of that view. It remains our expectation that any increase in prices, due to tariffs, will likely prove temporary. Our confidence in the continuation of the broad decline in inflation is supported by the expectation that tariffs are unlikely to increase again in 2026. Therefore, we expect a further moderation in inflationary pressure as we look to the back half of 2026.
Greater concern should now turn to the apparent weakness in the labor market, in our view. The recent release of the August payroll report confirms that a dramatic slowdown in job creation is now occurring. An average of less than 30,000 jobs per month has been created over the past three months. While this outcome was well below the expectations of many strategists, it is consistent with our expectations for a weaker jobs market. Of particular significance is the notion that the US economy is no longer creating sufficient jobs to employ newly formed households, despite the arguable decline in the breakeven rate. This slowdown in jobs and corresponding rise in unemployment requires action by the Fed. Unfortunately, this Fed has been slow to act. The Fed’s caution, while understandable given the uncertainty surrounding public policy and global macroeconomic conditions, has further dampened economic growth, which will likely require the Fed to reduce interest rates more than otherwise would have been necessary, had they been more proactive in their easing.
What does this mean for municipal bond investors?
The muni market has endured a multitude of slings and arrows year-to-date, plagued by uncertainties affecting institutional and retail investors alike. Given these pressures, it should surprise very few that municipal bond returns struggled during the first half of 2025 as the tax-exemption of munis was under threat and the market was forced to absorb the highest level of new issuance in its history. With that uncertainty now fading, given the passage of the One Big Beautiful Bill Act, which preserved the tax-exemption of munis, coupled with steadier technical conditions, we believe that munis are positioned to perform well going forward. Municipal bond yields are now delivering compelling tax-free income that is among the highest in over a decade. Long duration municipal bonds are particularly attractive, in our view, given the high taxable equivalent yields investors can achieve by extending out the curve. We have expressed this view in our strategies to date, and we believe that our client portfolios are well positioned for the expected change in interest rates. The AAA municipal bond curve slope 2s/30s, the additional yield investors receive by extending from 2-year to 30-year maturities, is now +225 basis points. The muni curve slope is now more than double the +120 bps of the US Treasury curve slope, further illustrating the relative cheapness of the longer duration munis.
Given that yields on short-term municipal bonds have fallen year-to-date, they now provide little compensation for the reinvestment rate risk investors are exposed to, should interest rates fall further, as is our expectation. For example, 2-year AAA rated municipal bonds now yield a paltry 2.1% compared to the +4.2% yield that AAA 20-year munis offer, as of 9/8/25. Investors, with a long-term investment horizon, can lock in taxable equivalent yields of approximately 8% to 9% or higher, depending on their tax bracket, final maturity, and state of residence, see Figure 2. When one also considers that the Fed is expected to cut interest rates by 1.50% to 1.75% by the end of 2026, according to the Fed’s Statement of Economic Projections (SEP), we would argue the window of opportunity for investors to act on this opportunity could be closing.
I heard interest rates are rising. Is that true?
No, interest rates are not rising. In fact, interest rates have been declining since the fall of 2023. Yet, one of the common concerns we still hear from investors is that extending the duration of their municipal bond holdings increases risks given expectations for rising rates. We caution that view, as it implies that short-term bonds carry little or no risk. While it is fair to say that short-term bonds are less sensitive to changes in interest rates, they are also now substantially lower yielding. Investors in short-term instruments are at risk of leaving potentially hundreds of basis points of yield and total return on the table, should interest rates continue to fall.
The economy is at an important inflection point. Declining payrolls and slowing growth should sufficiently motivate the Fed to cut rates further. The cutting of interest rates is a realization that economic conditions are too tight, and the US economy has slowed considerably, putting future job creation at risk. Its also reasonable to expect short-term yields on cash and short duration securities to continue falling in the weeks and months ahead. In an effort to overcome the substantial decline in income, investors with large allocations to cash and short duration instruments will likely experience going forward, we would recommend extending duration to lock in higher yields for the long term. For investors paying taxes, the cheapness of municipal bonds, relative to other fixed income investments, presents a compelling opportunity to achieve equity-like returns, just from the tax-free cash flow that municipal bonds offer, with historically lower risks than comparable asset classes. Should interest rates decline further, principal appreciation could also be significant. Given that this investment opportunity will likely prove to be temporary, we recommend clients and advisors act expeditiously to take advantage of the current municipal bond market dislocation while they still can.
Should you have any questions about this commentary or best manner in which to capitalize on the opportunities we are seeing in the market today, please do not hesitate to reach out to us directly.
Kind Regards,
Andrew Clinton
CEO
This material has been provided for informational purposes only and is not intended by Clinton Investment Management to provide and should not be relied on for tax, legal or accounting advice. If such advice is required, please consult with your own tax, legal and accounting advisors.
Please remember that past performance may not be indicative of future results. Net-of-fee performance returns are calculated by deducting the actual Clinton Investment Management, LLC investment management fee from the gross returns. Performance returns include the reinvestment of income and capital gains. Actual results may differ from the composite results depending upon the size of the account, investment objectives, guidelines and restrictions, inception of the account and other factors. Different types of investments involve varying degrees of risk, and there can be no assurance that the future performance of any specific investment, investment strategy, or product, made reference to directly or indirectly in this newsletter (article), will be profitable, equal any corresponding indicated historical performance level(s), or be suitable for your portfolio. Due to various factors, including changing market conditions, the content may no longer be reflective of current opinions or positions. Moreover, you should not assume that any discussion or information contained in this newsletter (article) serves as the receipt of, or as a substitute for, personalized investment advice from Clinton Investment Management, LLC. To the extent that a reader has any questions regarding the applicability of any specific issue discussed above to his/her individual situation, he/she is encouraged to consult with the professional advisor of his/her choosing. Please consult with an investment professional before making any investment using content or implied content from any investment manager. A copy of our current written disclosure statement discussing our advisory services and fees is available upon request.
The views and opinions expressed are not necessarily those of the distributing firm or any affiliates. Nothing discussed or suggested should be construed as permission to supersede or circumvent your firm’s policies, procedures, rules, and guidelines.