Market Commentary

  • Munis have now delivered solid returns, for the past three consecutive years, resulting in over +13% returns cumulatively, or +4.00% annually, as of 1/19/26, according to the Bloomberg Muni Index.
  • Municipal bonds delivered performance that was higher, on a taxable equivalent basis, than every other fixed income market in 2025, including Treasury bonds, corporate bonds, high yield bonds, and global bonds, according to Bloomberg Municipal Bond Index, as of 1/19/26.
  • There are now almost a dozen states considering raising income or surtaxes on taxpayers, including individuals making more than $1 million.
  • We say to those in the highest tax brackets, just because you are paranoid doesn’t mean they aren’t after you.
  • Holders of cash and short duration instruments are giving up the opportunity to increase their tax-free cash flow by 100%, as the yield differential between short and long-term municipal bonds is now over 2.00% or 200 basis points, more than double the yield of short-term bonds and after-tax taxable cash yields.
  • Municipal bond investors willing to extend out to modestly longer maturities can achieve taxable equivalent yields approaching 7%.

The casual market observer is forgiven if, in early 2025, they concluded it would be an underwhelming year for municipal bond returns. If you close one eye and look at the first half of 2025 in isolation, that summation would have appeared reasonable. However, for those with an investment horizon longer than six months, you would have also seen the second half of 2025 deliver one of the most powerful recoveries in municipal bond prices in some time. As our clients and loyal followers know, we have been imploring investors to prepare for a turnaround in market sentiment, for a number of quarters. We remained firm in our conviction that a recovery in municipal bond performance would likely be swift and powerful. In the early days of 2026, we reflect not only on market conditions that have brought us to this point but also contemplate the various risks and opportunities investors are likely to experience in 2026.

Market conditions in the first half of 2025 were indeed challenging. The municipal bond market stumbled out of the gate, plagued by uncertainty surrounding the potential loss of municipal bonds’ coveted tax-exempt status. Fear of losing the municipal bond tax-exemption has become the proverbial Sword of Damocles, hanging over the muni market, for over three decades. While the risk of losing tax-exempt status is perceived to be quite low, for constitutional reasons, as we discussed extensively in our Q1 2025 Market Commentary Shaken, it has not stopped retail investors from overreacting each time the topic begins to leak into media headlines. The mere whisper of the potential loss of muni tax-exemption gets the financial news printing presses humming. The media and the broader financial services industry understand all too well that there is no better way to alarm wealthy, tax sensitive, retail investors, in an effort to capture their breathless attention, than to suggest that one of the last and purest tax shelters available may be taken away. Nonetheless, once the news broke that the One Big Beautiful Bill Act (OBBBA) had passed and the muni tax-exemption had been preserved, retail nerves settled as quickly as they had previously risen. Investors took stock of the relative cheapness of the municipal asset class more broadly and wisely concluded that munis were simply too attractive to ignore, igniting the recovery and rally that ensued in the latter part of 2025, which has continued into 2026.

What started off as a spiritless year for munis, ended on a particularly strong note.  Munis have now delivered solid returns, for the past three consecutive years, resulting in over +13% returns cumulatively, or +4.00% annually, as of 1/19/26, according to the Bloomberg Muni Index. Some may also be surprised to learn that municipal bonds delivered performance that was higher, on a taxable equivalent basis, than every other fixed income market in 2025, including Treasury bonds, corporate bonds, high yield bonds, and global bonds, according to Bloomberg Municipal Bond Index, as of 1/19/26.

While this may come as a shock to some, it is a reminder of how frequently investors fail to properly measure and appreciate the full value of the tax-free income that municipal bonds deliver. The challenge for investors is that municipal bond returns are almost always quoted on an after-tax basis, that is returns are not “grossed up” to reflect the tax-free income they generate, while taxable markets, bonds and equities, almost always quote returns on a before-tax basis. We frequently remind investors, to achieve a true apples-to-apples comparison of their investments, they must carefully calculate the “taxable equivalent” yield and return of their municipal bond holdings when comparing with taxable alternatives. We understand that not everyone enjoys pouring over statements, performing mathematical equations. However, not doing so can result in lost performance and/or unnecessarily increased risk exposures.

Just Because You’re Paranoid Doesn’t Mean They Aren’t After You

Despite the passage of the OBBBA, we know that taxes more broadly will likely remain roughly the same for most taxpayers across the country. Yet, taxes may actually be rising for many wealthy investors, depending on where they live. There are now almost a dozen states considering raising income or surtaxes on taxpayers, including indviduals making more than $1 million. A number of states are also considering additional wealth taxes, i.e. California. We believe these initiatives are the clearest indication that state and local governments are planning to increase revenue rather than reduce spending, as they face the reality of billions of dollars in budgets deficits. While this may be bad news for taxpayers, it is welcome news for municipal bond holders, as we expect municipal credit quality to remain stable going forward. Our confidence is tied to the knowledge that municipalities have the authority and, in several instances, a willingness to raise revenues though higher taxes and user fees to fund debt service and future expenditures. This new reality speaks directly to the power of tax-free cash flow and will likely mean that the tax-exempt income municipal bonds deliver will increase in value as we look to a future of higher local taxes, even if Federal income tax rates remain roughly the same. Therefore, we say to those in the highest tax brackets, just because you are paranoid doesn’t mean they aren’t after you.

Risks Seen and Unseen

We continue to believe that the greatest risk facing fixed income investors going forward remains reinvestment rate risk. The very high opportunity cost of investor exposures to cash, preferred savings, and short duration instruments is evident in the current slope of the yield curve, see Figure 1 below.

The ‘AAA’, tax-free municipal bond and taxable Treasury curves illustrate clearly the meaningfully positive slope of the curve. As you can see, the additional yield investors receive for investing in longer, rather than short, duration bonds is significant. Investors with heavy exposures to preferred savings, cash, and short duration bonds, may be unaware that the lower yield and income they now receive translates into a significant loss of cash flow going forward. This is a relatively new experience for investors as short-term rates were quite high just two years ago. For example, holders of cash and short duration instruments are giving up the opportunity to increase their tax-free cash flow by 100%, as the yield differential between short and long-term municipal bonds is now over 2.00% or 200 basis points, more than double the yield of short-term bonds and after-tax taxable cash yields.

Why Inflation Isn’t Rising

As we consider the factors that have put downward pressure on interest rates over the past two years, we expect many of those conditions to persist in 2026 as well. Inflation was a popular talking point throughout 2025. We continue to believe any pressure from increased tariffs is likely to be temporary, as we do not expect the current administration to materially increase tariffs yet again in 2026. Therefore, the modest price increases that may have flowed through to prices of goods and services, due to tariffs, are likely to diminish as base effect comparisons improve going forward. Owners’ Equivalent Rent (OER), which represents roughly a third of the US Consumer Price Index (CPI), fell consistently throughout 2025. We expect declines in residential and commercial real estate values to continue in 2026, exerting further  downward pressure on OER. Therefore, we expect CPI to continue to moderate going forward. As inflation falls, real returns (that is return after inflation) of fixed cash flow rises. For example, municipal bond investors willing to extend out to modestly longer maturities can achieve taxable equivalent yields approaching 7%. Assuming CPI averages approximately 2.70% during 2026, as it did in 2025, the real, inflation-adjusted yield that muni investors could achieve would be over +4.2%, on a net basis. For this reason, we continue to believe that municipal bonds, given their superior taxable equivalent yields and risk adjusted return potential, are among the most compelling investments investors, in the highest tax brackets, can make in 2026.

CIM Investment Management News

We are very pleased to share that 2025 was another powerful year of growth for CIM.  We added new team members and continued to meaningfully grow our assets under management, as evidenced by the roughly $900 million inflows into our strategies in 2025. We are grateful for the ongoing trust and loyalty of the clients and advisors we serve. We are also fully aware that our success would not be possible without the dedication, commitment, and strength that each CIM team member delivers to our clients each day. We would like to express our deepest thanks to all of our partners and look forward to another year of growth in 2026.

Should you have any questions about this commentary or where we are seeing the best opportunities in the municipal bond market today, please do not hesitate to reach out.

Sincerely,

Andrew Clinton

CEO

*The taxable equivalent yield represents the yield that must be earned on a fully taxable investment in order to equal the tax-exempt yield of the composite. The taxable equivalent yield is calculated by dividing the tax-exempt yield by 1- the maximum federal income tax rate of 40.8% (37% federal + 3.8% NII tax).

This material has been provided for informational purposes only and is not intended by Clinton Investment Management to provide and should not be relied on for tax, legal or accounting advice. If such advice is required, please consult with your own tax, legal and accounting advisors.

Please remember that past performance may not be indicative of future results. Net-of-fee performance returns are calculated by deducting the actual Clinton Investment Management, LLC investment management fee from the gross returns. Performance returns include the reinvestment of income and capital gains. Actual results may differ from the composite results depending upon the size of the account, investment objectives, guidelines and restrictions, inception of the account and other factors.  Different types of investments involve varying degrees of risk, and there can be no assurance that the future performance of any specific investment, investment strategy, or product, made reference to directly or indirectly in this newsletter (article), will be profitable, equal any corresponding indicated historical performance level(s), or be suitable for your portfolio. Due to various factors, including changing market conditions, the content may no longer be reflective of current opinions or positions. Moreover, you should not assume that any discussion or information contained in this newsletter (article) serves as the receipt of, or as a substitute for, personalized investment advice from Clinton Investment Management, LLC. To the extent that a reader has any questions regarding the applicability of any specific issue discussed above to his/her individual situation, he/she is encouraged to consult with the professional advisor of his/her choosing. Please consult with an investment professional before making any investment using content or implied content from any investment manager. A copy of our current written disclosure statement discussing our advisory services and fees is available upon request.

The views and opinions expressed are not necessarily those of the distributing firm or any affiliates. Nothing discussed or suggested should be construed as permission to supersede or circumvent your firm’s policies, procedures, rules, and guidelines.

If your municipal bond manager didn’t proactively harvest meaningful losses via tax loss swapping during the first half of 2025, you likely missed out on one of the best opportunities in the past three years to protect your broader asset allocation from capital gains taxes. For this reason, we are providing important information below that, going forward, we believe can help municipal bond investors maximize their total after-tax return.

  • While many municipal bond managers and investors often wait until the end of the year to harvest losses, Clinton Investment Management (CIM), through our Tax Optimization Protocol (TOP), proactively harvests losses throughout the year, as opportunities present themselves. We do so as we are fully aware that technical fluctuations in the muni market, often tied to temporary factors, as was the case in 2025, create fleeting conditions requiring diligence and responsive action.
  • The application of our TOP overlay strategy has delivered real and meaningfully positive benefits, as the strength of this strategy is that has historically reduced the tax burden our clients would have otherwise been forced to pay
  • CIM’s Municipal Credit Opportunities and intermediate Municipal Market Duration strategies have generated absolute returns that are among the highest in the municipal bond SMA industry*, over the past three years, cumulatively.
  • When we consider the additional tax alpha** delivered to our clients, our strategies are among the most cost effective on a net-of-fees and after-tax basis.
  • We understand there may be other municipal bond managers that “claim” to provide ongoing tax loss harvesting. That said, we also know that what a manager says and what they do are unfortunately not always the same. This is particularly true for 2025. CIM reports the tax alpha we generate directly on our strategy fact sheets for all advisors and investors to see. Be wary of any municipal bond manager that claims to provide tax harvesting yet is unable or unwilling to publicly disclose the tax alpha they generate. We frequently find municipal bond managers using tax loss harvesting language as part of their marketing strategy. Less often is it a material part of their overall investment strategy and protocols.
  • We encourage investors to reach out to their municipal bond manager to discuss the extent to which they harvested losses on their behalf during the first six months of 2025. If the response from the manager is slow, evasive, or underwhelming, you are likely working with the wrong manager.
  • Given this week’s news that continued cooling and moderation in inflation caused the Consumer Price Index (CPI) to come in below expectations, together with the Fed’s stated intention to lower interest rates further in 2026, investors are missing out on the rising “real” returns that municipal bonds, with maturities greater than ten years, currently offer.
  • The muni yield curve is inverted between 1-4 years with yields of roughly 2.2%, while investors can achieve yields over 4.00% further out on the curve, equating to roughly 7%, on a taxable equivalent basis+ for those in the highest tax bracket. Munis continue to be one of the highest yielding fixed income solutions for investors seeking stable tax-free cash flow and enhanced portfolio diversification.

If you have any questions about our clearly differentiated municipal bond strategies and how our TOP overlay can help reduce your tax burden in the future, please feel free to reach out to us as we would be happy to assist in any way we can.

* PSN as of 9/30/2025

** CIM defines Tax Alpha as the potential value created through tax-loss harvesting techniques that fully offset a capital gain and is derived by calculating the composite capital losses divided by the average composite assets and multiplied by the maximum capital gains tax rate of 23.8% (20% plus 3.8% Net Investment Income Tax), for any stated period. Tax-loss harvesting is any transaction resulting in a capital loss.  Although realized capital losses can potentially offset capital gains, reduce taxes paid, and enhance after-tax returns, individual results will vary dependent upon an investor’s actual tax rates, the presence of current or future capital loss carry forwards, and other investor specific tax circumstances. Tax-loss harvesting may not achieve actual value creation.

+ The taxable equivalent yield represents the yield that must be earned on a fully taxable investment in order to equal the tax-exempt yield of the composite. The taxable equivalent yield is calculated by dividing the tax-exempt yield by 1- the maximum federal income tax rate of 40.8% (37% federal + 3.8% NII tax).

This material has been provided for informational purposes only and is not intended by Clinton Investment Management to provide and should not be relied on for tax, legal or accounting advice. If such advice is required, please consult with your own tax, legal and accounting advisors.

Please remember that past performance may not be indicative of future results. Different types of investments involve varying degrees of risk, and there can be no assurance that the future performance of any specific investment, investment strategy, or product, made reference to directly or indirectly in this newsletter (article), will be profitable, equal any corresponding indicated historical performance level(s), or be suitable for your portfolio. Due to various factors, including changing market conditions, the content may no longer be reflective of current opinions or positions. Moreover, you should not assume that any discussion or information contained in this newsletter (article) serves as the receipt of, or as a substitute for, personalized investment advice from Clinton Investment Management, LLC. To the extent that a reader has any questions regarding the applicability of any specific issue discussed above to his/her individual situation, he/she is encouraged to consult with the professional advisor of his/her choosing. Please consult with an investment professional before making any investment using content or implied content from any investment manager. A copy of our current written disclosure brochure discussing our advisory services and fees is available upon request.

The views and opinions expressed are not necessarily those of the distributing firm or any affiliates. Nothing discussed or suggested should be construed as permission to supersede or circumvent your firm’s policies, procedures, rules, and guidelines.

  • The municipal bond market is enjoying its third consecutive year of meaningfully positive total return, 12% on a cumulative basis, since 2023. CIM’s strategies have delivered meaningfully higher returns both net-of-fees and after taxes.
  • Municipal bond total returns for the combined period of September through October 2025 were the highest in over 30 years.
  • Long duration municipal bonds have outperformed short duration munis by roughly +6.00%, or +600 basis points, since September 1st.
  • Municipal bond TEY’s now exceed nearly every other fixed-income asset class, according to Morgan Stanley Research.
  • Consistent with our expectations, moderate inflation and weakening labor market conditions have driven the Fed to restart its easing cycle, cutting interest rates twice with more cuts expected in the near-term.
  • Our strategies offer yields between 6% and 7%, on a TEY basis for those in the highest tax bracket, thereby meaningfully compensating investors to swap out of low yield, low return short duration cash and passive bond strategies.
  • High-net-worth investors with exposure to Treasury bond ladders would also benefit from transitioning to municipal bonds, given the meaningful yield decline we have seen in short-term Treasury bonds and the higher taxable equivalent yields municipal bonds offer.
  • We remain constructive on the outlook for the municipal bond market through the end of 2025 and into 2026.

As we approach the close of the fourth quarter and the Thanksgiving holiday, this time of year presents an opportunity to reflect on events of the past several months and the impact of our decisions on achieving our individual and collective long-term goals and objectives. CIM would also like to express our sincerest gratitude to the clients and advisors we serve for their ongoing trust, confidence, and loyalty. We take our role as responsible stewards of our client’s wealth extremely seriously. For this reason, we are deeply grateful for the value we have delivered throughout 2025, despite yet another tumultuous period in the financial markets. As we evaluate events of this past year, we also carefully consider the risks that lie before us.

While the year is not yet over, it may come as surprise to some that the municipal bond market is enjoying its third consecutive year of meaningfully positive total return, 12% on a cumulative basis, since 2023, according to the Bloomberg Municipal Bond Index. CIM’s strategies have delivered meaningfully higher returns both net-of-fees and after taxes.  For example, our Municipal Credit Opportunities and Municipal Market Duration strategies have delivered over +17% and +15% respectively, net-of-fees on a cumulative basis, over the aforementioned period. This was not the case just a few months ago, as the first seven months of the year were decidedly weak for the municipal bond market. This caused some short-term investors in the muni market to become disenchanted with returns they had achieved. Some were even motivated to liquidate the entirety of their municipal holdings, selling longer-term bonds to invest in short duration paper or cash. Unfortunately, for those investors, this rash decision was ill-timed as they missed out on one of the strongest rallies in the history of the municipal bond market at end of the third quarter. For example, long duration municipal bonds have outperformed short duration munis by roughly +6.00%, or +600 basis points, since September 1st, 2025, according to Barclays Municipal Research.  Municipal bond total returns for the combined period of September through October 2025 were the highest in over 30 years.  The surge in municipal bond prices over the past several weeks has transformed an otherwise lackluster year of returns into a decidedly solid year for the muni market and our strategies in particular.

There is significantly more room for longer duration munis to run, in our view. This is partly due to the relatively high yields one can still achieve in municipal bonds that are exempt from Federal and, in many instances, state income taxes. This tax-exemption is powerful, as a tax-free return of 4.00% translates to a taxable equivalent yield (TEY)* of +6.80% annually, for those in the highest federal tax-bracket. When we consider the substantially lower risk that municipal bonds carry, the diversifying force municipal bonds provide in one’s asset allocation becomes apparent.  Municipal bond TEY’s now exceed nearly every other fixed-income asset class, according to Morgan Stanley Research, see Figure 1 below.

We deeply appreciate our clients’ patience and conviction in the fundamental macroeconomic view we shared many months ago. We know the first half of the year was a challenging period for many investors. This experience is yet another reminder that a patient, measured, and calm approach to investing and assessing one’s return experience is essential, given the degree of short-term volatility the exists in markets today. Our disciplined approach to portfolio construction and positioning is reflected in our long-held views on the direction of the US economy and expressed in our portfolios, enabling our clients to participate fully in the municipal bond market rally of the past two months.

Consistent with our expectations, moderate inflation and weakening labor market conditions have driven the Fed to restart its easing cycle, cutting interest rates twice with more cuts expected in the near-term. For this reason, we believe investors who remain largely underweight fixed income, and municipal bonds in particular, should consider increasing their municipal bond holdings to lock in higher yields before rates fall further. Most savings rates and money market funds have now fallen well below the important 4.00% taxable yield threshold. Our strategies offer yields between 6% and 7%, on a TEY basis for those in the highest tax bracket, thereby meaningfully compensating investors to swap out of low yield, low return short duration cash and passive bond strategies. High-net-worth investors with exposure to Treasury bond ladders would also benefit from transitioning to municipal bonds, given the meaningful yield decline we have seen in short-term Treasury bonds and the higher taxable equivalent yields municipal bonds offer.

As investors consider the most appropriate asset allocations to help navigate rising uncertainty, driven by extreme valuations on risk assets, we understand some investors may compare the returns of the high-flying S&P 500 to the returns municipal bonds have delivered over the past few years. We would caution against this comparison. The highly volatile S&P 500 is demonstrably different than high quality, stable, and durable municipal bonds. As such, munis should not be expected to deliver a similar return experience. The S&P 500 carries dramatically higher risk, roughly 400% more risk, as measured by the S&P 500’s ten-year standard deviation of return of approximately 16%. On the contrary, municipal bonds play a vastly different role in an investor’s asset allocation. Municipal bonds, by definition, offer investors stable cash flow and safety of principal, providing consistent competitive tax-free cash flow while also preserving the wealth investors have accumulated through hard work and discipline, often across generations.

What lies ahead?

We have good news to share. We expect municipal bond fundamental credit quality to remain stable going forward. Moreover, CIM’s demonstrated ability to identify and select stable-to-improving issuers, as illustrated by our long-term track record of success, provides confidence to investors seeking to successfully leverage the opportunity to moderately move down in credit quality to meaningfully increase yield, without materially amplifying credit risk. We know with certainty that we don’t know what lies ahead. Market conditions and public policy shifts serve as stark reminders that risk persists regardless of how much some in the investing community would like us to ignore it. For this reason, we believe investors will continue to seek out lower risk, higher yielding instruments. Therefore, we remain constructive on the outlook for the municipal bond market through the end of 2025 and into 2026. Technical market conditions that existed during the first half of the year have begun to dissipate, as evidenced by the outperformance of the municipal bond market in recent months.  As we approach year-end, the expected decline in new issuance and elevated yields investors can still achieve on longer duration municipal bonds will likely continue to attract investor inflows supporting municipal bond performance in the months ahead.

Should you have any questions regarding the municipal bond market or this commentary, please do not hesitate to reach out.

Sincerely,

Andrew Clinton

CEO

*The taxable equivalent yield represents the yield that must be earned on a fully taxable investment in order to equal the tax-exempt yield of the composite. The taxable equivalent yield is calculated by dividing the tax-exempt yield by 1- the maximum federal income tax rate of 40.8% (37% federal + 3.8% NII tax).

This material has been provided for informational purposes only and is not intended by Clinton Investment Management to provide and should not be relied on for tax, legal or accounting advice. If such advice is required, please consult with your own tax, legal and accounting advisors.

Please remember that past performance may not be indicative of future results. Net-of-fee performance returns are calculated by deducting the actual Clinton Investment Management, LLC investment management fee from the gross returns. Performance returns include the reinvestment of income and capital gains. Actual results may differ from the composite results depending upon the size of the account, investment objectives, guidelines and restrictions, inception of the account and other factors.  Different types of investments involve varying degrees of risk, and there can be no assurance that the future performance of any specific investment, investment strategy, or product, made reference to directly or indirectly in this newsletter (article), will be profitable, equal any corresponding indicated historical performance level(s), or be suitable for your portfolio. Due to various factors, including changing market conditions, the content may no longer be reflective of current opinions or positions. Moreover, you should not assume that any discussion or information contained in this newsletter (article) serves as the receipt of, or as a substitute for, personalized investment advice from Clinton Investment Management, LLC. To the extent that a reader has any questions regarding the applicability of any specific issue discussed above to his/her individual situation, he/she is encouraged to consult with the professional advisor of his/her choosing. Please consult with an investment professional before making any investment using content or implied content from any investment manager. A copy of our current written disclosure statement discussing our advisory services and fees is available upon request.

The views and opinions expressed are not necessarily those of the distributing firm or any affiliates. Nothing discussed or suggested should be construed as permission to supersede or circumvent your firm’s policies, procedures, rules, and guidelines.

  • Muni tax loss harvesting and opportunity to deliver tax alpha in the first 9 months was successful for our clients, as CIM has delivered over 0.30%, 30 basis points of tax alpha year-to-date. *
  • The positive narrative shift and constructive outlook for the municipal bond market has resulted in the best total return for October in over 30 years.
  • The scale of the opportunity in longer duration municipal bonds persists, as munis with longer maturities remain one to two z-scores/standard deviations cheap to corporates, indicating the scale of the opportunity for municipal bonds to continue outperforming.
  • As we expected, the Fed has resumed cutting interest rates due to considerable weakening in the labor market and subdued inflation, despite tariff effects.
  • Investors with large exposures to passive, short duration bonds and preferred savings are likely to experience significantly reduced cash flow, as short-term rates fall further and reinvestment opportunities dwindle.
  • Munis continue to offer some of the highest returns, on an after-tax basis from an income perspective, compared to other fixed income alternatives.
  • Our strategies, with an average credit quality of AA/A, are targeting taxable equivalent yields of 7% to over 8%, assuming an individual is in the highest tax bracket and a resident of high tax states like NY or CA.** Broader municipal sector credit fundamentals remain resilient notwithstanding a slowdown in the economy.
  • Municipal bond defaults are rare and sector default rates are strikingly lower than their corporate peers.
  • Expected further declines in CPI in 2026, as base effects of tariffs fade, appear not to be priced into fixed income markets.
  • Technical conditions have historically had an outsized impact on municipal bond returns. Muni technicals have turned significantly positive in recent weeks as demand, in the form of asset class inflows into municipal bond mutual funds, have accelerated since September as supply has fallen by over 58% since 10/16/25.

*CIM defines Tax Alpha as the potential value created through tax-loss harvesting techniques that fully offset a capital gain and is derived by calculating the composite capital losses divided by the average composite assets and multiplied by the maximum capital gains tax rate of 23.8% (20% plus 3.8% Net Investment Income Tax), for any stated period. Tax-loss harvesting is any transaction resulting in a capital loss.  Although realized capital losses can potentially offset capital gains, reduce taxes paid, and enhance after-tax returns, individual results will vary dependent upon an investor’s actual tax rates, the presence of current or future capital loss carry forwards, and other investor specific tax circumstances. Tax-loss harvesting may not achieve actual value creation.

**The taxable equivalent yield represents the yield that must be earned on a fully taxable investment in order to equal the tax-exempt yield of the composite. The taxable equivalent yield is calculated by dividing the tax-exempt yield by 1- the maximum federal income tax rate of 40.8% (37% federal + 3.8% NII tax). For CA the calculation includes the addition of a maximum state tax rate of 13.30%.  For NY the calculation includes the addition of a maximum state tax rate of 9.65% applicable to a single filer in the taxable income bracket between $1,077.551 and $5,000,000.

This material has been provided for informational purposes only and is not intended by Clinton Investment Management to provide and should not be relied on for tax, legal or accounting advice. If such advice is required, please consult with your own tax, legal and accounting advisors.

Please remember that past performance may not be indicative of future results. Net-of-fee performance returns are calculated by deducting the actual Clinton Investment Management, LLC investment management fee from the gross returns. Performance returns include the reinvestment of income and capital gains. Actual results may differ from the composite results depending upon the size of the account, investment objectives, guidelines and restrictions, inception of the account and other factors.  Different types of investments involve varying degrees of risk, and there can be no assurance that the future performance of any specific investment, investment strategy, or product, made reference to directly or indirectly in this newsletter (article), will be profitable, equal any corresponding indicated historical performance level(s), or be suitable for your portfolio. Due to various factors, including changing market conditions, the content may no longer be reflective of current opinions or positions. Moreover, you should not assume that any discussion or information contained in this newsletter (article) serves as the receipt of, or as a substitute for, personalized investment advice from Clinton Investment Management, LLC. To the extent that a reader has any questions regarding the applicability of any specific issue discussed above to his/her individual situation, he/she is encouraged to consult with the professional advisor of his/her choosing. Please consult with an investment professional before making any investment using content or implied content from any investment manager. A copy of our current written disclosure statement discussing our advisory services and fees is available upon request.

The views and opinions expressed are not necessarily those of the distributing firm or any affiliates. Nothing discussed or suggested should be construed as permission to supersede or circumvent your firm’s policies, procedures, rules, and guidelines.

  • The recent Bureau of Labor Statistics (BLS) payroll revision showing downward revisions of a record 911,000 jobs in the year through March 2025, further demonstrates the weakness of the current job market.
  • The Consumer Price Index (CPI) peaked at 9.1% in 2022 and has since fallen by over 68% to 2.86%, as of August 2025.
  • An average of less than 30,000 jobs per month has been created over the past three months.
  • The Fed’s caution, while understandable given the uncertainty surrounding public policy and global macroeconomic conditions, has further dampened economic growth, which will likely require the Fed to reduce interest rates more.
  • The muni curve slope is now more than double the +120 bps of the US Treasury curve slope, further illustrating the relative cheapness of the longer duration munis.
  • No, interest rates are not rising.
  • We would recommend extending duration to lock in higher yields for the long term.

Since the launch of the Fed easing cycle in September 2024, some have claimed that the Fed was cutting interest rates for the “right” reasons. The persistent view was that the economy had grown rapidly during the three years following the pandemic. Therefore, an eventual slowdown in GDP growth was to be expected. Some believed that the Fed’s decision to begin cutting rates in September 2024 was not a harbinger of weaker economic growth and deteriorating employment environment, rather, it was a “normalization” of interest rates to a level that was better suited to a slower growth environment. The Fed’s decision to begin cutting the Federal Funds rate was seen as a minor adjustment, necessary to better align financial conditions with a more stable, albeit slower, economic growth trajectory.

Conversely, our contention has been that the Fed’s decision was, in fact, the launch of a necessary easing cycle, with the goal of forestalling further declines in GDP growth and arresting the decline of what appeared to be a weakening labor force. Our view remains that the Fed did not embark on a path of rate cuts to simply normalize market conditions. We firmly believe the Fed foresaw increasing risks of further economic deceleration and its impact on unemployment, which is why they were compelled to act. We now see the Fed’s actions were not only warranted, but also insufficient, given the downward trajectory of economic conditions and US payrolls that are now evident, as illustrated by last Friday’s extremely weak payroll report, see Figure 1. The recent Bureau of Labor Statistics (BLS) payroll revision showing downward revisions of a record 911,000 jobs in the year through March 2025, further demonstrates the weakness of the current job market.

The Fed’s dual mandates of stable prices and maximum employment have been in tension for some time. While inflation has fallen dramatically since its peak in 2022, job gains, until this year, appeared to be stable. The Consumer Price Index (CPI) peaked at 9.1% in 2022 and has since fallen by over 68% to 2.86%, as of August 2025.  The Fed’s stated goal of 2.00% inflation is now within reach, yet some remain fearful that upward pressure from tariffs could cause a reversal in this multi-year, downward trend in CPI.  It is important to note that we are not of that view. It remains our expectation that any increase in prices, due to tariffs, will likely prove temporary. Our confidence in the continuation of the broad decline in inflation is supported by the expectation that tariffs are unlikely to increase again in 2026. Therefore, we expect a further moderation in inflationary pressure as we look to the back half of 2026.

Greater concern should now turn to the apparent weakness in the labor market, in our view. The recent release of the August payroll report confirms that a dramatic slowdown in job creation is now occurring.  An average of less than 30,000 jobs per month has been created over the past three months.  While this outcome was well below the expectations of many strategists, it is consistent with our expectations for a weaker jobs market. Of particular significance is the notion that the US economy is no longer creating sufficient jobs to employ newly formed households, despite the arguable decline in the breakeven rate. This slowdown in jobs and corresponding rise in unemployment requires action by the Fed. Unfortunately, this Fed has been slow to act. The Fed’s caution, while understandable given the uncertainty surrounding public policy and global macroeconomic conditions, has further dampened economic growth, which will likely require the Fed to reduce interest rates more than otherwise would have been necessary, had they been more proactive in their easing.

What does this mean for municipal bond investors?

The muni market has endured a multitude of slings and arrows year-to-date, plagued by uncertainties affecting institutional and retail investors alike. Given these pressures, it should surprise very few that municipal bond returns struggled during the first half of 2025 as the tax-exemption of munis was under threat and the market was forced to absorb the highest level of new issuance in its history. With that uncertainty now fading, given the passage of the One Big Beautiful Bill Act, which preserved the tax-exemption of munis, coupled with steadier technical conditions, we believe that munis are positioned to perform well going forward. Municipal bond yields are now delivering compelling tax-free income that is among the highest in over a decade. Long duration municipal bonds are particularly attractive, in our view, given the high taxable equivalent yields investors can achieve by extending out the curve. We have expressed this view in our strategies to date, and we believe that our client portfolios are well positioned for the expected change in interest rates. The AAA municipal bond curve slope 2s/30s, the additional yield investors receive by extending from 2-year to 30-year maturities, is now +225 basis points. The muni curve slope is now more than double the +120 bps of the US Treasury curve slope, further illustrating the relative cheapness of the longer duration munis.

Given that yields on short-term municipal bonds have fallen year-to-date, they now provide little compensation for the reinvestment rate risk investors are exposed to, should interest rates fall further, as is our expectation. For example, 2-year AAA rated municipal bonds now yield a paltry 2.1% compared to the +4.2% yield that AAA 20-year munis offer, as of 9/8/25. Investors, with a long-term investment horizon, can lock in taxable equivalent yields of approximately 8% to 9% or higher, depending on their tax bracket, final maturity, and state of residence, see Figure 2. When one also considers that the Fed is expected to cut interest rates by 1.50% to 1.75% by the end of 2026, according to the Fed’s Statement of Economic Projections (SEP), we would argue the window of opportunity for investors to act on this opportunity could be closing.

I heard interest rates are rising. Is that true?

No, interest rates are not rising.  In fact, interest rates have been declining since the fall of 2023. Yet, one of the common concerns we still hear from investors is that extending the duration of their municipal bond holdings increases risks given expectations for rising rates. We caution that view, as it implies that short-term bonds carry little or no risk.  While it is fair to say that short-term bonds are less sensitive to changes in interest rates, they are also now substantially lower yielding. Investors in short-term instruments are at risk of leaving potentially hundreds of basis points of yield and total return on the table, should interest rates continue to fall.

The economy is at an important inflection point. Declining payrolls and slowing growth should sufficiently motivate the Fed to cut rates further. The cutting of interest rates is a realization that economic conditions are too tight, and the US economy has slowed considerably, putting future job creation at risk. Its also reasonable to expect short-term yields on cash and short duration securities to continue falling in the weeks and months ahead. In an effort to overcome the substantial decline in income, investors with large allocations to cash and short duration instruments will likely experience going forward, we would recommend extending duration to lock in higher yields for the long term. For investors paying taxes, the cheapness of municipal bonds, relative to other fixed income investments, presents a compelling opportunity to achieve equity-like returns, just from the tax-free cash flow that municipal bonds offer, with historically lower risks than comparable asset classes. Should interest rates decline further, principal appreciation could also be significant. Given that this investment opportunity will likely prove to be temporary, we recommend clients and advisors act expeditiously to take advantage of the current municipal bond market dislocation while they still can.

Should you have any questions about this commentary or best manner in which to capitalize on the opportunities we are seeing in the market today, please do not hesitate to reach out to us directly.

Kind Regards,

Andrew Clinton

CEO

This material has been provided for informational purposes only and is not intended by Clinton Investment Management to provide and should not be relied on for tax, legal or accounting advice. If such advice is required, please consult with your own tax, legal and accounting advisors.

Please remember that past performance may not be indicative of future results. Net-of-fee performance returns are calculated by deducting the actual Clinton Investment Management, LLC investment management fee from the gross returns. Performance returns include the reinvestment of income and capital gains. Actual results may differ from the composite results depending upon the size of the account, investment objectives, guidelines and restrictions, inception of the account and other factors.  Different types of investments involve varying degrees of risk, and there can be no assurance that the future performance of any specific investment, investment strategy, or product, made reference to directly or indirectly in this newsletter (article), will be profitable, equal any corresponding indicated historical performance level(s), or be suitable for your portfolio. Due to various factors, including changing market conditions, the content may no longer be reflective of current opinions or positions. Moreover, you should not assume that any discussion or information contained in this newsletter (article) serves as the receipt of, or as a substitute for, personalized investment advice from Clinton Investment Management, LLC. To the extent that a reader has any questions regarding the applicability of any specific issue discussed above to his/her individual situation, he/she is encouraged to consult with the professional advisor of his/her choosing. Please consult with an investment professional before making any investment using content or implied content from any investment manager. A copy of our current written disclosure statement discussing our advisory services and fees is available upon request.

The views and opinions expressed are not necessarily those of the distributing firm or any affiliates. Nothing discussed or suggested should be construed as permission to supersede or circumvent your firm’s policies, procedures, rules, and guidelines.

  • On Friday, July 4th, 2025 (Independence Day), President Trump signed the “One Big Beautiful Bill Act” (OBBBA) into law, a day after its passage by Congress.
  • This massive piece of legislation, a cornerstone of the President and Republican Party’s agenda, extends expiring provisions of the Tax Cuts and Jobs Act (TCJA) of 2017 and incorporates other tax priorities of President Trump. It also outlines spending reductions and revenue-raisers to partly offset the estimated cost of the aforementioned tax provisions.
  • OBBBA makes permanent several expiring tax cuts in the TCJA and potentially enhances some of those cuts. This is largely expected to benefit individual income taxpayers as the TCJA had made corporate tax breaks permanent.
  • Crucial to the municipal bond industry, the bill left the highly coveted federal municipal bond tax-exemption intact. This followed months of intense lobbying and congressional outreach by industry groups/proponents highlighting the vital role municipal bonds play in financing core U.S. infrastructure. The potential threat of municipal bonds losing their tax exemption dominated sector headlines and caused consternation amongst investors over the past few months.
  • CIM, unlike some of our peers, repeatedly reiterated its view that these fears were overstated and a broader loss of municipal tax-exemption was highly unlikely (see links to our previous commentaries here). With this legislation’s passage, we feel vindicated in the durability of our conviction as we seek to effectively and responsibly invest client assets through uncertain times.

Key OBBBA provisions specifically as they apply to CIM holdings are outlined below:

  • Extension of Alternative Minimum Tax Exemption (AMT). The higher individual AMT exemption amounts and phase-out income thresholds (with tweaks to the income thresholds) have been permanently extended for tax years starting on January 1, 2026. The current AMT provisions were slated to expire at calendar year-end 2025 and would have reverted to pre-TCJA levels. This permanent extension should, in our view, bolster AMT bond valuations and liquidity.
  • Private Activity Bonds. The legislation left private activity bonds intact and expanded their scope. Private activity bonds are extensively used to finance projects across municipal sectors such as airports, housing, toll roads, high-speed rail and other municipal project financings.
  • Increased Endowment Tax Rates. Private higher education institutions will be subject to increased endowment tax rates based on their endowment levels per student and enrollment size. The new tax rates are progressive with higher rates most meaningfully impacting larger, wealthier institutions with sizeable endowments. Notably, the legislation’s endowment tax rates were materially scaled back from the more onerous House-passed version, somewhat blunting its negative effects on impacted institutions.
    • Our higher education sector exposure is intentionally modest given underlying sector credit risks (weakened demographics, affordability challenges, to name a few) and relative value considerations. For our higher education holdings, we do not foresee material changes to credit profiles.
  • Significant Medicaid Cuts. Key changes include imposing work requirements for recipients, more frequent redeterminations for enrollees, freezes and a lowering of provider taxes by states, reduction of supplemental payments, coupled with enhanced eligibility rules and checks. While this could prove disruptive to states and healthcare provider finances (particularly those serving larger Medicaid/self-pay populations), we expect them to take proactive steps to blunt the negative effects of some of these shocks. Moreover, some of these requirements and cuts will be staggered over time.

This material has been provided for informational purposes only and is not intended by Clinton Investment Management to provide and should not be relied on for tax, legal or accounting advice. If such advice is required, please consult with your own tax, legal and accounting advisors.

Please remember that past performance may not be indicative of future results. Net-of-fee performance returns are calculated by deducting the actual Clinton Investment Management, LLC investment management fee from the gross returns. Performance returns include the reinvestment of income and capital gains. Actual results may differ from the composite results depending upon the size of the account, investment objectives, guidelines and restrictions, inception of the account and other factors.  Different types of investments involve varying degrees of risk, and there can be no assurance that the future performance of any specific investment, investment strategy, or product, made reference to directly or indirectly in this newsletter (article), will be profitable, equal any corresponding indicated historical performance level(s), or be suitable for your portfolio. Due to various factors, including changing market conditions, the content may no longer be reflective of current opinions or positions. Moreover, you should not assume that any discussion or information contained in this newsletter (article) serves as the receipt of, or as a substitute for, personalized investment advice from Clinton Investment Management, LLC. To the extent that a reader has any questions regarding the applicability of any specific issue discussed above to his/her individual situation, he/she is encouraged to consult with the professional advisor of his/her choosing. Please consult with an investment professional before making any investment using content or implied content from any investment manager. A copy of our current written disclosure statement discussing our advisory services and fees is available upon request.


The views and opinions expressed are not necessarily those of the distributing firm or any affiliates. Nothing discussed or suggested should be construed as permission to supersede or circumvent your firm’s policies, procedures, rules, and guidelines.

  • Given the breathtaking drawdown in US equity markets, and fixed income yield and price volatility, we believe the term that best captures the current market tone is shaken.
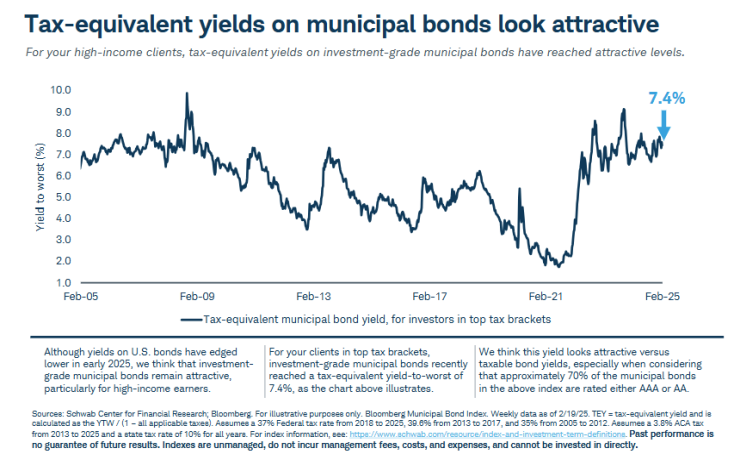
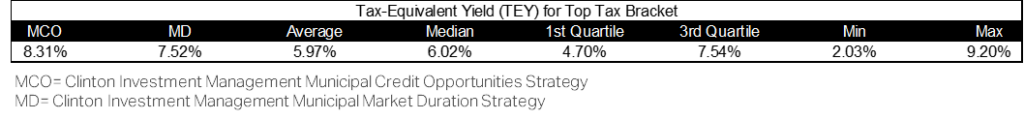
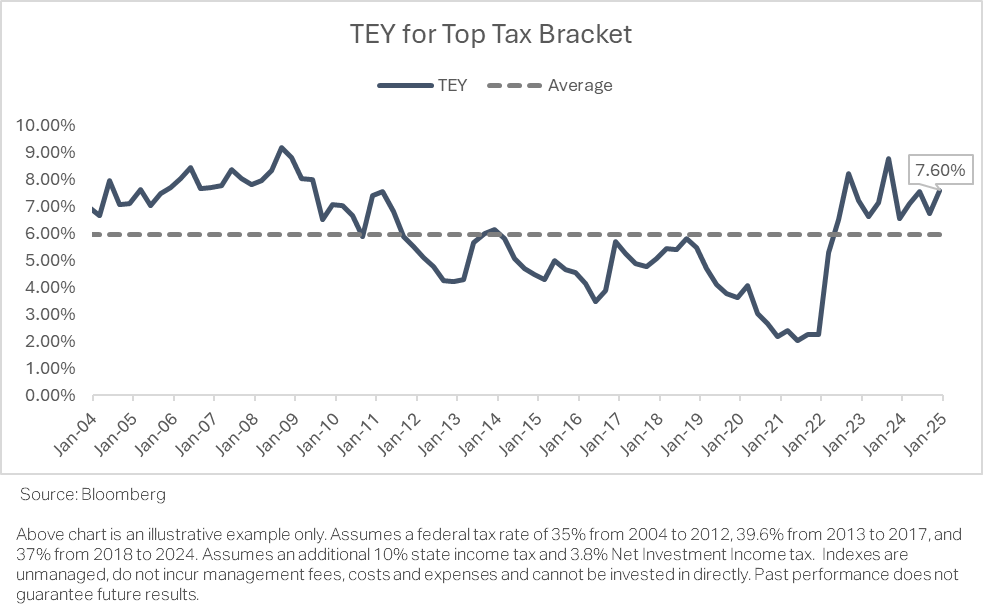
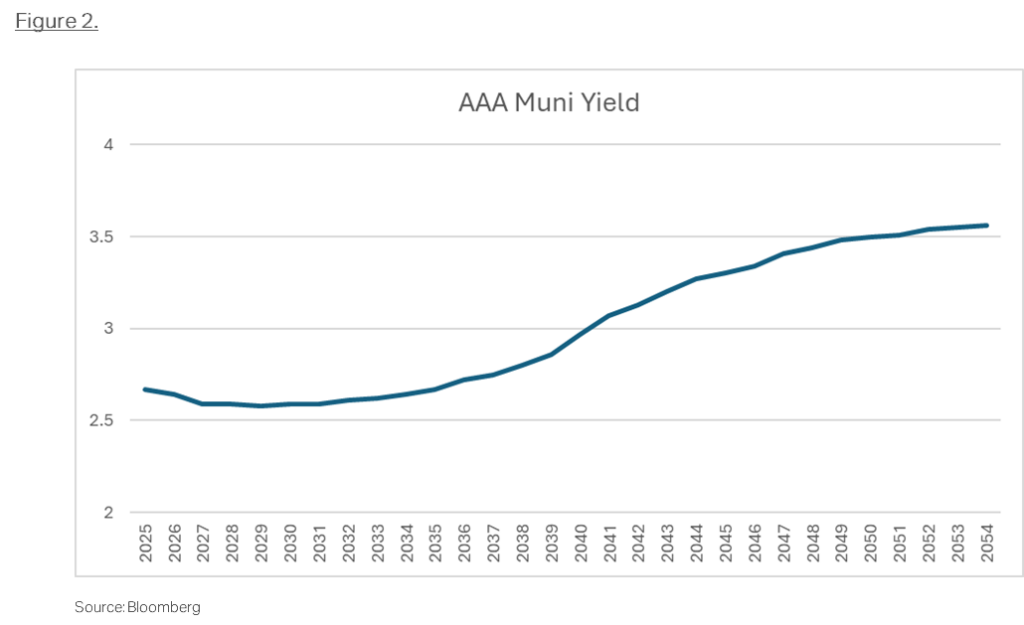
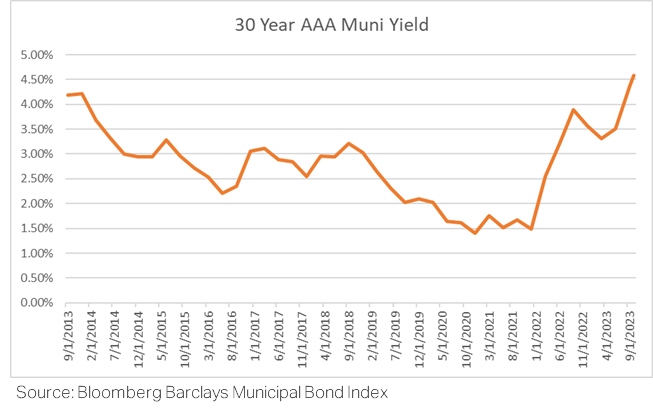
  • The absolute level of tax-free munis in the 20-30 year area of the curve is now approaching 5.00%, or a taxable equivalent yield of almost 10.00%.
  • Retroactively removing the tax-exemption of munis would likely violate the Federalist underpinnings of the 10th Amendment.
  • While it is often difficult in times of uncertainty and market stress to take advantage of market dislocations like we are seeing now, history has shown that doing so can be a meaningful source of wealth creation as investors seek to reach their long-term investment goals in the years ahead.

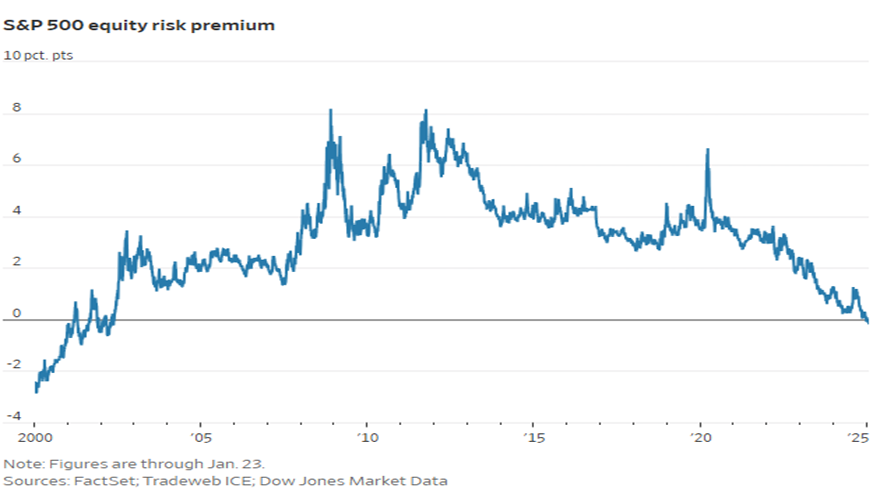
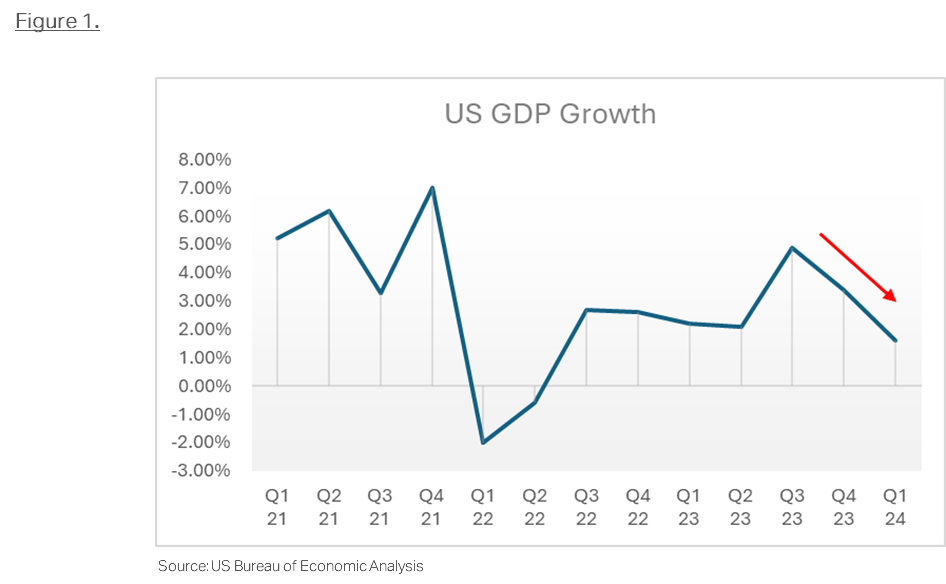
As we consider the impact of the dramatic weakening of consumer sentiment in Q1, the possibility of widespread global tariff implementation by the US, increased probability of a US recession, the breathtaking drawdown in US equity markets, fixed income yield and price volatility, we believe the term that best captures the current market tone is shaken. Confidence appears to be leaking, if not racing out, of almost every asset class, at a pace harkening back to the darkest days of COVID. We are reminded, in this moment, of the importance of disciplined and diversified asset allocation, together with a steadfast commitment to one’s long-term investment horizon. Deviation from these essential tenets can be disastrous in terms of achieving one’s investment objectives over time. For example, investors entered Q1 with the highest exposure to equities and the lowest exposure to fixed income in over a decade, according to Morningstar1. With the benefit of hindsight, we now see that investor asset allocations were sub-optimally positioned for the current market environment, vigorous portfolio rebalancing may not have been systematically applied as equity values surged by roughly 50% over the past two years and roughly 90% in the past five years.

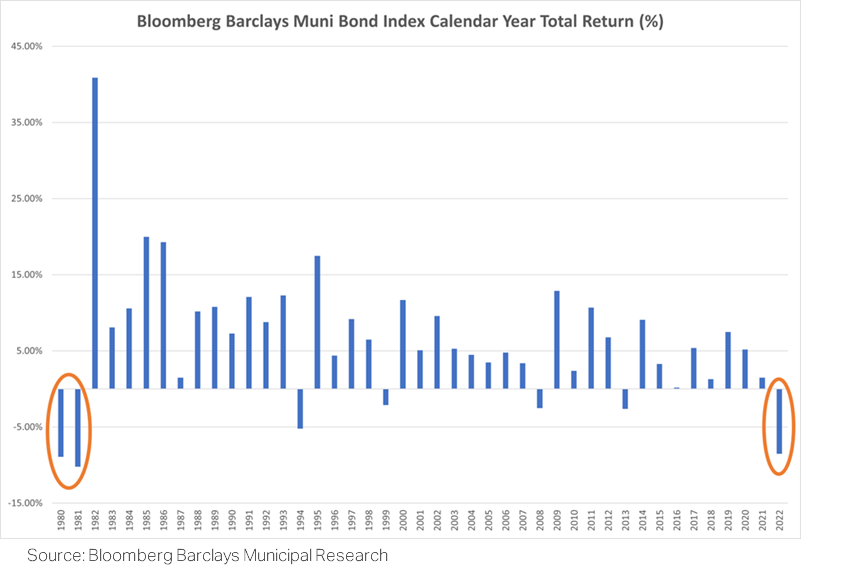
While investors should be comforted by the fact that high-grade fixed income has helped preserve principal for investors during Q1, that may be little consolation for those with large exposures to high beta instruments. Municipal bond investors have also not been immune to recent market volatility. The flight to quality in the Treasury market, together with significant seasonal, tax-time selling by retail investors, seeking to make tax payments by April 15, has caused municipal bonds to underperform Treasuries year-to-date. For example, amidst the chaotic market gyrations just yesterday, April 7th, Treasury yields rose by roughly 30 basis points (bps), from intraday lows, yet municipal bond yields rose by 35 bps. Tax-free muni yields, on longer duration bonds, are now approaching 100% of the yield on taxable US Treasuries. Given that munis are tax-exempt and Treasury bonds are taxable, the 100% ratio has typically represented a very attractive entry point for investors as the tax-exemption is clearly being undervalued, in our view. Moreover, the absolute level of tax-free munis in the 20-30 year area of the curve is now approaching 5.00%, or a taxable equivalent yield of almost 10.00% for someone in the highest tax bracket. The selloff in munis, is due in part to investor fears that the tax-exemption of munis is at risk of revocation by Congress, to help pay for the extension of the Tax Cuts and Jobs Act. At CIM, we consider that outcome as an extremely low probability event, given the estimated revenue created would be roughly $250 billion over the next 10 years, while the higher borrowing costs that state and local governments would incur is estimated to exceed $800 billion. In addition, a recent National Law Review article clearly lays out that retroactively removing the tax-exemption of munis would likely violate the Federalist underpinnings of the 10th Amendment, thereby making the removal of the tax-exemption unconstitutional at face value. However, Congress does have the authority to restrict the issuance of tax-exempt bonds on a going forward basis. In the event Congress chose to remove the tax-exemption of all future muni bond issuance, doing so would dramatically increase the value of outstanding tax-free bonds, in our view. As we consider the underlying credit quality of the municipal issuers we hold on behalf of clients, we are reminded that very little has changed in the past few days, weeks, or months that would jeopardize the stable outlook for municipal credit quality more broadly.

The main question we have been fielding from many investors of late is very straight forward. What should we do now? If one’s investment horizon remains long-term in nature, we recommend revisiting your asset allocations to be sure your current portfolio properly represents your risk tolerance, consistent with your long-term goals. If you are properly allocated there is likely nothing one must do. While it is often easier said than done, we encourage investors to remain calm when faced with the volume of current market noise we are experiencing. For investors who have been fortunate to accumulate cash, we recommend locking in higher yields, especially those available on municipal bonds, as we expect the muni market to normalize at lower yields in the weeks and months ahead. While it is often difficult in times of uncertainty and market stress to take advantage of market dislocations like we are seeing now, history has shown that doing so can be a meaningful source of wealth creation as investors seek to reach their long-term investment goals in the years ahead.

If you should have any questions regarding this commentary or where we are finding the best values today, please do not hesitate to reach out to us.

Kindest Regards,

Andrew Clinton

CEO

  1. 1Morningstar: How Far Out-of-Wack are Fund Investors’s Asset Allocations? $800 Billion, Give or Take ↩︎

Please remember that past performance may not be indicative of future results. Net-of-fee performance returns are calculated by deducting the actual Clinton Investment Management, LLC investment management fee from the gross returns. Performance returns include the reinvestment of income and capital gains. Actual results may differ from the composite results depending upon the size of the account, investment objectives, guidelines and restrictions, inception of the account and other factors.  Different types of investments involve varying degrees of risk, and there can be no assurance that the future performance of any specific investment, investment strategy, or product, made reference to directly or indirectly in this newsletter (article), will be profitable, equal any corresponding indicated historical performance level(s), or be suitable for your portfolio. Due to various factors, including changing market conditions, the content may no longer be reflective of current opinions or positions. Moreover, you should not assume that any discussion or information contained in this newsletter (article) serves as the receipt of, or as a substitute for, personalized investment advice from Clinton Investment Management, LLC. To the extent that a reader has any questions regarding the applicability of any specific issue discussed above to his/her individual situation, he/she is encouraged to consult with the professional advisor of his/her choosing. Please consult with an investment professional before making any investment using content or implied content from any investment manager. A copy of our current written disclosure statement discussing our advisory services and fees is available upon request.


The views and opinions expressed are not necessarily those of the distributing firm or any affiliates. Nothing discussed or suggested should be construed as permission to supersede or circumvent your firm’s policies, procedures, rules, and guidelines.

Given the substantial increase in market volatility in the past few weeks, we wanted to take a moment to provide some context and recent economic data that could be helpful as investors consider the best path forward. We firmly believe the current market environment, together with further slowing in US GDP will increasingly drive investors towards lower risk assets, until such time that there is greater clarity and certainty in terms of the outlook for growth. In volatile environments such as these, the attractive taxable equivalent return and stability that municipal bonds offer, is a compelling option for investors who are currently exposed to significantly higher drawdown potential in risk assets. The municipal bond investment solutions that Clinton Investment Management offers, given the higher tax-free cash flow and total return we have delivered over time relative the broader Zephyr municipal bond manager universe, are an excellent complement for investors seeking to lock in higher yields before rates fall further.

  • Credit card delinquencies are now the highest they have been since the Great Financial Crisis.
  • The average credit card interest rate is currently over 22%.
  • January retail sales month-over-month -0.8%.
  • Univ of Michigan Consumer Sentiment 67.8, lowest level since Nov 2023.
  • Housing starts -9.8%, largest decline since March of 2024.
  • Initial jobless claims +242k for the week ended Feb. 22, up from 221k the prior week.
  • Jobless claims are at a three-month high. 
  • Government layoffs and reduction in spending expected to pressure unemployment higher over time.
  • Core Personal Consumption Expenditures (PCE) 2.6% in Jan 2025, down from 2.9%.
  • Services Purchasing Managers Index 49.7, measures below 50 indicate contraction, the first since Jan 2023.
  • ISM Manufacturing New Orders 48.6, measures below 50 indicate contraction.
  • Bonds are now outperforming stocks going back to the night of the Presidential election.
  • GDPNow estimate for Q1 GDP -2.8%, a material swing from previous estimates.

Please remember that past performance may not be indicative of future results. Net-of-fee performance returns are calculated by deducting the actual Clinton Investment Management, LLC investment management fee from the gross returns. Performance returns include the reinvestment of income and capital gains. Actual results may differ from the composite results depending upon the size of the account, investment objectives, guidelines and restrictions, inception of the account and other factors.  Different types of investments involve varying degrees of risk, and there can be no assurance that the future performance of any specific investment, investment strategy, or product, made reference to directly or indirectly in this newsletter (article), will be profitable, equal any corresponding indicated historical performance level(s), or be suitable for your portfolio. Due to various factors, including changing market conditions, the content may no longer be reflective of current opinions or positions. Moreover, you should not assume that any discussion or information contained in this newsletter (article) serves as the receipt of, or as a substitute for, personalized investment advice from Clinton Investment Management, LLC. To the extent that a reader has any questions regarding the applicability of any specific issue discussed above to his/her individual situation, he/she is encouraged to consult with the professional advisor of his/her choosing. Please consult with an investment professional before making any investment using content or implied content from any investment manager. A copy of our current written disclosure statement discussing our advisory services and fees is available upon request.


The views and opinions expressed are not necessarily those of the distributing firm or any affiliates. Nothing discussed or suggested should be construed as permission to supersede or circumvent your firm’s policies, procedures, rules, and guidelines.

  • Investors in financial markets today are playing a different game altogether, as the rules of the game appear to change by the minute or, shall we say, by the tweet
  • If one were looking for a bull market, look no further than the bull market in uncertainty
  • The President has the authority to increase tariffs on goods/raw materials, not services. Goods represent less than 6% of US GDP
  • With a high degree of conviction, we believe the tax-exempt nature of the municipal bond market will be preserved
  • We are reminded that income is the most important contributor to one’s total return over time. A yield of over 4% tax free equates to over 7% return on a taxable equivalent basis, for someone in the highest tax bracket.   There are very few, if any, investment alternatives that offer a similar return potential, with the same or lower risk
  • The relatively low risk of municipals, as compared to other historically riskier asset classes, together with the attractive tax-free cash flow they now provide, are a compelling option for investors looking to increase their cash flow while they await greater clarity to what the future may bring

Even the most casual of chess players is aware that, in its simplest form, chess requires careful assessment of an opponent’s strengths and weaknesses and serious consideration of a multitude of tactics, ranging from aggressive to defensive. Risks must be measured together with the expected reactions of an opponent to the movement of varied game pieces, all while playing on a two-dimensional game surface. For those who have attempted to play three-dimensional chess, the complexity of the game is exponentially more challenging, as players are required to consider strategy and movement on multiple surfaces, at varying heights and depths. Investors in financial markets today are playing a different game altogether, as the rules of the game appear to change by the minute or, shall we say, by the tweet. The Federal Reserve cut the Federal Funds rate by 0.50%, or 50 basis points in September. Yet, for the first time in history, Treasury yields rose by 1.00%, or 100 basis points, over the following three months. Chairman Powell could not have been clearer in his press conference in September, when he stated that the Fed was “recalibrating” its focus away from inflation and toward supporting the jobs market. The Fed had made substantial progress toward its 2% inflation goal and was expecting a further decline in inflation, over time, albeit on a bumpy path. However, investors did not respond to the Fed’s actions or statements, as they appeared distracted by the constant barrage of news headlines surrounding the Presidential election. Who can blame investors for this distraction considering that it has taken up all the oxygen in the room for many months, the result being a material increase in stock and bond market volatility, since September. Investors are understandably struggling to assess the potential impact that tariffs and a possible tax cut extension could have on inflation and the broader economy. Fear has captured investor imaginations, triggering visions of runaway inflation that could result in dire interest rate outcomes. Investors have been forced to navigate headlines crafted to instill just those kinds of fears. Like three-dimensional chess, investors are being forced to consider possible scenarios and outcomes, with imperfect information, which, in many cases are unknowable, without the benefit of time. If one were looking for a bull market. Look no further than the bull market in uncertainty.

It is important to note that President Trump used tariffs extensively during his first term. However, few appear to remember that inflation was lower when Trump left office than we he arrived. We also now see, as was the case in recent negotiations with Mexico and Canda, Trump clearly intends to use tariffs for leverage in trade negotiations. When we consider the potential impact of tariffs, even on the largest scale, the President has the authority to increase tariffs on goods/raw materials, not services. Goods represent less than 6% of US GDP. Therefore, even in the event that tariffs are implemented broadly, which, despite the rhetoric, now appears less likely, the inflationary and economic impacts would likely be limited and ephemeral, in our view.

We must also consider the positive, yet fleeting, economic impact of the Tax Cut and Jobs Act (TCJA) during Trump’s first term. While it was not that long ago, it appears that some have forgotten that the US economy slowed considerably during the last year of President Trump’s first term, even prior to the Covid onset. While some have claimed an “unleashing” of the US economy could occur in Trump’s second term, due to the extension of the TCJA and a more pro-business posture, in our view, too little consideration has been given to the notion that, during Trump’s first Term, taxes were higher when he took office. Therefore, when tax rates fell there was a resulting, albeit temporary, positive economic impact?. This time is different. Tax rates have already been reduced. The most likely outcome is simply an extension of the existing tax regime where the immediate economic benefit is likely to be muted. Another important consideration is that the Trump administration will need to use budget reconciliation to extend the JCTA, meaning that he will need to “create” revenue to offset lost revenue from the extension of tax cuts. We see Trump already acting on this promise, through the Department of Government Efficiency (DOGE), as he seeks to reduce the size of government and government expenditures via the elimination, of what the administration has deemed, waste and fraud. If the President is successful, the resulting impact will be higher joblessness, as government employees are laid off, resulting in reduced consumption, and lower tax collections for state and local governments. This will have a chilling effect on the broader economic growth, in our view.

What does this all mean for municipal bond investors? One of the roughly 100 tax preference items the administration has listed as a potential source of revenue, to extend the TCJA, is the repeal of the tax exemption on municipal bonds. This has caused a significant degree of concern for municipal bond investors.  However, this notion has been floated many times over the past 30 years. Each time the resulting outcome is very little to no change in the municipal tax exemption. While we never like to hear that the tax-exemption of munis is being threatened, it is important to note that any change to the outstanding bonds would be highly unlikely as it would be arguably unconstitutional to do so retroactively and would, no doubt, be vigorously challenged in the courts. In the scenario where the tax-exemption on munis is removed for all new issues, any outstanding tax-free bonds would remain as such, making them highly desirable. Given the finite nature of supply and an increased demand, we would expect outstanding bonds to perform quite well. While private activity and select higher education institutions may be exposed to this risk, we believe the broader municipal market will remain unscathed. With a high degree of conviction, we believe the tax-exempt nature of the municipal bond market will be preserved.

As we consider that path forward for municipal fixed income investors, we are reminded that income is the most important contributor to one’s total return over time. A yield of over 4% tax free equates to over 7% return on a taxable equivalent basis*, for those in the highest tax bracket.   There are very few, if any, investment alternatives that offer a similar return potential with the same or lower risk. For example, the current Equity Risk Premium (ERP), the premium equity investors should be paid for the higher risk of holding public equities, is now negative compared to US Treasury bonds for the first time since the early 2000’s, see Figure 1. 

Figure 1.

Throughout history, when the ERP has been negative, equity prices have fallen meaningfully.  While that is not to say equity prices will fall anytime soon, it simply means the risks have risen and investors are not being compensated for that risk, in our view. Therefore, we believe that municipal bonds are well positioned given the substantial income one can generate and retain on an after-tax basis.

Credit quality in the municipal bond market remains stable and we expect that to persist going forward. According to Morningstar+, investors are currently the most overweight stocks and underweight bonds they have been in over ten years. When one also considers that yields on preferred savings accounts and cash instruments have declined materially, since the Fed began cutting rates, those that are heavily exposed to cash and short duration instruments should be compelled to begin extending out of cash, given the steep slope of the municipal curve.

As we consider the many dimensions of the broader marketplace, it is clear investors have imperfect information from which to draw firm conclusions and plan their next move. The only thing we know with certainty, is that the outlook is uncertain.  In these moments, the relatively low risk of municipals, as compared to other historically riskier asset classes, together with the attractive tax-free cash flow they now provide, are a compelling option for investors looking to increase their cash flow while they await greater clarity as to what the future may bring.

Clinton Investment Management 2024 Firm Update

We would like to take a moment to express our sincerest thanks to the advisors and clients with whom we partner. Last year was another strong year of growth and relative performance for our firm and our strategies. We added staff, new investment capabilities, expanded our offices to our new location in downtown Stamford, while achieving our strongest year of asset growth in our firm’s history. Over $1.3 billion in new client contributions were committed to our clearly differentiated investment strategies in 2024. I would like to take this opportunity to recognize our extraordinary team who worked tirelessly, throughout the year, to achieve these important milestones. Most importantly, we know that our success would not be possible without the ongoing trust, confidence, and loyalty of our client’s and advisor partnerships, for which we are deeply grateful. We remain steadfast in our commitment to consistently delivering meaningful value to our clients over the long term and we look forward to another strong year in 2025.

If you should have any questions regarding this commentary or the municipal bond market more broadly, please do not hesitate to contact us directly.

Best Regards,

Andrew Clinton

CEO

*The taxable equivalent yield is calculated by dividing the tax-exempt yield by 1- the maximum federal income tax rate of 40.8% (37% federal + 3.8% Medicare tax).

+Jan 22, 2025  Jeffrey Ptak Morningstar How Far Out-of-Whack Are Fund Investors’ Asset Allocations? $800 Billion, Give or Take https://www.morningstar.com/portfolios/how-far-out-of-whack-are-fund-investors-asset-allocations-800-billion-give-or-take

Please remember that past performance may not be indicative of future results. Net-of-fee performance returns are calculated by deducting the actual Clinton Investment Management, LLC investment management fee from the gross returns. Performance returns include the reinvestment of income and capital gains. Actual results may differ from the composite results depending upon the size of the account, investment objectives, guidelines and restrictions, inception of the account and other factors.  Different types of investments involve varying degrees of risk, and there can be no assurance that the future performance of any specific investment, investment strategy, or product, made reference to directly or indirectly in this newsletter (article), will be profitable, equal any corresponding indicated historical performance level(s), or be suitable for your portfolio. Due to various factors, including changing market conditions, the content may no longer be reflective of current opinions or positions. Moreover, you should not assume that any discussion or information contained in this newsletter (article) serves as the receipt of, or as a substitute for, personalized investment advice from Clinton Investment Management, LLC. To the extent that a reader has any questions regarding the applicability of any specific issue discussed above to his/her individual situation, he/she is encouraged to consult with the professional advisor of his/her choosing. Please consult with an investment professional before making any investment using content or implied content from any investment manager. A copy of our current written disclosure statement discussing our advisory services and fees is available upon request.


The views and opinions expressed are not necessarily those of the distributing firm or any affiliates. Nothing discussed or suggested should be construed as permission to supersede or circumvent your firm’s policies, procedures, rules, and guidelines.

The year 2024 proved to be quite volatile for fixed income investors, as yields fell dramatically from their heights in 2023, then rose again in the fourth quarter (Q4), closing the year within a stone’s throw of the highest levels of the year. The rise in yields in Q4 was due, in large part, to uncertainty surrounding what a Trump presidency could mean for inflation and the economy. We also saw equity markets reach valuation levels that are among the highest in recorded history. In light of these extraordinary market conditions, we have provided a list below of the most important factors we believe municipal bond investors should consider as they seek to navigate this uncertainty over the next twelve months.

  • Broader municipal sector credit fundamentals remain steady
  • Substantial reserve balances amplified by unprecedented federal pandemic aid buffer against potential revenue disruption
  • Municipal sector is highly rated with positive ratings momentum since the onset of the pandemic
  • Upgrade-to-downgrade ratios have been strongly positive for 14-15 consecutive quarters through Q3 2024*
  • Municipal bond default rates remain well below 1% compared with 2.6% for corporates**
  • Vast majority of municipal defaults are unrated credits (approximately 87%***), a striking contrast to corporate defaults
  • Absolute municipal bond yields are compelling, particularly for investors in higher tax brackets. See chart below
  • For the month of December 2024, municipal bond yields rose sharply, albeit by a smaller magnitude than Treasuries:
    • The 10-year Treasury yield rose to 4.57% from 4.19%, or 38 basis points. The 10-year ‘AAA’ municipal bond yield moved to 3.04% from 2.76%, cheapening by 28 basis points. The 30-year MMD ‘AAA’ municipal bond yield moved to 3.90% from 3.59%, or 31 basis points
    • The 10-year municipal-to-treasury ratio was essentially unchanged. It started the month at 65.8% and moved to 66.7% using a federal tax rate of 39.6%
    • According to JP Morgan, Bloomberg’s Investment Grade Tax-Exempt Municipal Index recorded a total return of -1.46% in December, culminating in a full-year return of 1.05% for 2024. This full-year performance outpaced the UST Index (+0.58%)
    • 2024 inflows into municipal bond funds were nearly $42 billion reflective of strong investor demand given yield, tax advantages, and diversification needs****
  • Municipal new-issue total supply was a record-high $504 billion in 2024. Supply is expected to remain solid in 2025, presenting a diverse investment opportunity set ****
  • December’s Personal Consumption Expenditures (PCE) Price Index, commonly referred to as core PCE, the Federal Reserve’s preferred measure of price changes, was below market consensus expectations (core PCE rose 2.8% year-over-year versus an expected 2.9%, while headline PCE inflation year-to-year was 2.4% versus an expected 2.5%). Continued moderating inflation should be favorable for the longer-term interest rate trajectory and fixed income investors

 Data sources:

*JP Morgan

**S&P: “2023 Annual U.S. Corporate Default And Rating Transition Study”

***Charles Schwab

****LSEG Lipper data

Please remember that past performance may not be indicative of future results. Net-of-fee performance returns are calculated by deducting the actual Clinton Investment Management, LLC investment management fee from the gross returns. Performance returns include the reinvestment of income and capital gains. Actual results may differ from the composite results depending upon the size of the account, investment objectives, guidelines and restrictions, inception of the account and other factors.  Different types of investments involve varying degrees of risk, and there can be no assurance that the future performance of any specific investment, investment strategy, or product, made reference to directly or indirectly in this newsletter (article), will be profitable, equal any corresponding indicated historical performance level(s), or be suitable for your portfolio. Due to various factors, including changing market conditions, the content may no longer be reflective of current opinions or positions. Moreover, you should not assume that any discussion or information contained in this newsletter (article) serves as the receipt of, or as a substitute for, personalized investment advice from Clinton Investment Management, LLC. To the extent that a reader has any questions regarding the applicability of any specific issue discussed above to his/her individual situation, he/she is encouraged to consult with the professional advisor of his/her choosing. Please consult with an investment professional before making any investment using content or implied content from any investment manager. A copy of our current written disclosure statement discussing our advisory services and fees is available upon request.


The views and opinions expressed are not necessarily those of the distributing firm or any affiliates. Nothing discussed or suggested should be construed as permission to supersede or circumvent your firm’s policies, procedures, rules, and guidelines.