
tax alpha

Market Dislocation Breeds Generational Opportunity

  • We firmly believe this swift reset in fixed income valuations has created an extraordinary, and generational buying opportunity for long-term investors.
  • The sudden shift in price has pushed tax-exempt nominal yields to levels that are among the highest observed in close to twenty years.
  • Depending on an investor’s specific state of residence, individuals can now capture equity-like taxable equivalent yields (TEYs) approaching or exceeding 10% in municipal bonds.
  • For the discerning wealth manager and high-net-worth investor, market dislocations should be viewed not as a risk to be feared, but as an attractive entry point to be exploited.
  • In high-tax states such as New York and California, where local tax brackets exceed 10% to 13%, the combined marginal tax rate approaches or exceeds 50%. In these specific jurisdictions, the TEY on a high-grade municipal portfolio yielding 5% can safely approach or exceed 10%.
  • To put this in perspective, an investor can potentially capture a highly predictable, double-digit tax-adjusted yield, backed by sectors such as essential public infrastructure, devoid of corporate execution risks, earnings vagaries, and equity market volatility that have historically characterized the corporate landscape.
  • An opportunity to lock in historically elevated yields now exists.

The third quarter proved to be a critical turning point for fixed-income markets, characterized by a dramatic macro-driven repricing that completely erased the steady gains achieved during the first half of the year. While tax-exempt yields drifted modestly higher throughout July and August, in tandem with a broader global selloff in fixed income, the narrative shifted aggressively in September. The primary catalyst for this upward pressure on municipal interest rates was a sharp, unrelenting surge in U.S. Treasury bond yields. This dynamic shift was driven almost entirely by a significant spike in global oil prices, which renewed inflation anxieties and upended the Federal Reserve’s projected path of monetary policy. The linkage between energy markets and fixed-income assets was undeniable, as evidenced by an extraordinary, near perfect correlation between crude oil prices and benchmark interest rates over the 90-day period ending September 30.

As Treasury yields broke through key technical resistance levels, the municipal market faced severe crosscurrents. The sudden drop in bond prices triggered extensive industry-wide selling, mutual fund outflows, and a mismatch between secondary market supply and institutional demand. This technical pressure, exacerbated by seasonal crosscurrents and proactive tax-loss harvesting, culminated in September recording its worst monthly total return for the municipal bond market since the global financial crisis of 2008.

Understandably, short-term price volatility is unsettling for investors and asset allocators. However, Clinton Investment Management views this dislocation through a highly optimistic lens. We firmly believe this swift reset in fixed income valuations has created an extraordinary, and generational buying opportunity for long-term investors. The sudden shift in price has pushed tax-exempt nominal yields to levels that are among the highest observed in close to twenty years1. For individuals positioned in the highest marginal tax brackets, the structural advantages of tax-exempt cash flow have rarely been more compelling. Depending on an investor’s specific state of residence, wealthy individuals in the highest tax brackets, can now capture equity-like taxable equivalent yields (TEYs) approaching or exceeding 10% in municipal bonds.2

As we look toward the remainder of the year, our outlook on the asset class is supported by strong structural fundamentals. We are of the view that underlying municipal credit quality remains remarkably solid and stable. State and local governments continue to maintain near-record rainy-day funds and robust cash balances, shielding them effectively from a cooling domestic economy. This underlying fundamental strength gives us deep confidence that investors can seek to lock in what are some of the highest tax-free yields in a generation, toward the goal of securing predictable income streams, while awaiting the resolution of the current geopolitical and macroeconomic uncertainties.

The September Energy Shock and Technical Reset

To fully comprehend the magnitude of the third-quarter market adjustment, one must analyze the unique relationship between commodity price inflation and fixed-income mechanics that defined the late summer. The quarter began with a relatively stable backdrop; July and August experienced typical summer technical patterns, characterized by a predictable reinvestment wave driven by seasonal coupon payments and principal maturities. However, underlying vulnerabilities were quietly building as core economic data remained stickier than market participants anticipated.

The true inflection point arrived in September, a month that will be remembered for its severe asset correlation and technical breakdown. The primary transmission mechanism was the energy sector. A rapid reduction in global crude supply, combined with resilient industrial demand, sent oil prices climbing. This energy shock immediately altered inflation expectations, forcing fixed-income investors to price in a “higher-for-longer” monetary regime.

The mathematical precision of this relationship was remarkable. Over the 90 days ending September 30, the correlation between crude oil and long-term Treasury yields rose to over 90%. This tight linkage meant that every incremental dollar increase in oil prices exerted upward pressure on interest rates. Municipal bonds, despite their tax-exempt status and distinct investor base, could not decouple from the broader Treasury selloff.

As benchmark yields surged, the municipal marketplace experienced a severe technical liquidation. Fixed-income mutual funds, including ETF’s, which had enjoyed steady inflows earlier in the year, faced sudden redemption pressures as retail investors reacted to declining net asset values (NAVs). To meet these redemptions, fund managers were forced to sell high-quality, liquid municipal positions into a market of disinclined buyers, putting ever increasing downward pressure on prices. This structural mismatch between eager sellers and hesitant buyers caused municipal yields to spike. When the dust settled, September registered a historic decline, marking the most painful monthly total return for tax-exempt investors since the depths of the 2008 financial crisis.

Taxable Equivalent Yields at Historical Extremes

For the discerning wealth manager and high-net-worth investor, market dislocations should be viewed not as a risk to be feared, but as an attractive entry point to be exploited. Fixed-income dynamics dictate that when nominal yields rise, the compounding value of tax-exemption expands for those in the highest tax brackets. We are currently witnessing an environment where the math heavily favors the tax-exempt allocator over almost every other credit asset class. See Figure 1 below3.

Figure 1.
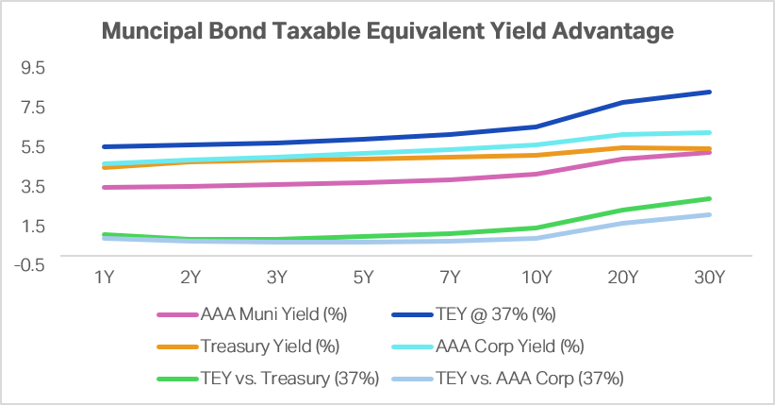
Consider the landscape of fixed income over the past two decades. For much of the post-2008 era, investors were forced to accept sub-2% nominal yields, compressing after-tax returns, and pushing individuals into riskier asset classes to meet their income requirements. Today, the landscape is entirely inverted. Nominal high-grade municipal bond yields across the intermediate and long portions of the yield curve have reached heights not seen since the early 2000s.

When these nominal yields are converted to a TEY, reflecting the true gross return that tax-free munis offer, when compared to taxable alternatives, the results are compelling. For an investor subject to the top federal bracket of 37% plus the 3.8% Net Investment Income Tax (NIIT), a 5.0% nominal tax-exempt yield transforms into an effective taxable return of roughly 8.44%4. When state and local taxes are layered into the equation, the value proposition becomes enhanced. In high-tax states such as New York and California, where local tax brackets exceed 10% to 13%, the combined marginal tax rate approaches or exceeds 50%. In these specific jurisdictions, the TEY on a high-grade municipal portfolio yielding 5% can safely approach or exceed 10%.2

To put this in perspective, investors have the opportunity to capture a highly predictable, double-digit tax-adjusted yield, backed by sectors such as essential public infrastructure, devoid of corporate execution risks, earnings vagaries, and equity market volatility that have historically characterized the corporate landscape.

Municipal Bond Credit Fundamentals Remain Solid

A vital component of our investment thesis is the stark divergence between market price volatility and underlying credit strength. While bond prices fluctuated wildly during the third quarter, the creditworthiness of municipal issuers remained stable. This fundamental divergence creates a stable foundation on which investors can allocate capital and build upon generational high cash flow, without taking on existential credit risk.

Following years of robust tax collections, federal pandemic stimulus distributions, and often conservative budgetary management, state and local governments entered this period of volatility with balance sheets that are among the strongest in modern history. Rainy-day funds across the nation remain near all-time highs and issuers have used the inflationary environment to their advantage, as rising nominal economic activity naturally bolsters sales tax collections and property tax assessments, providing an organic hedge against their own rising operational costs.

Moreover, the structural nature of municipal debt possesses inherent safeguards.  Unlike corporate issuers that frequently rely on short-term commercial paper or face constant debt rollover risk in volatile credit markets, the vast majority of municipal debt is structured as long-term, fixed-rate amortization, according to the Tax Policy Center.

Consequently, local governments are not as exposed to sudden spikes in their interest expense profiles; their debt service costs remain locked in at historical levels, preserving cash flow for essential operations and debt repayment. Historical default data from rating agencies consistently reinforce this reality, showing that investment-grade municipal defaults remain an exceedingly rare anomaly, keeping the asset class structurally sound5.

Locking in Yield Amid Macro Headwinds

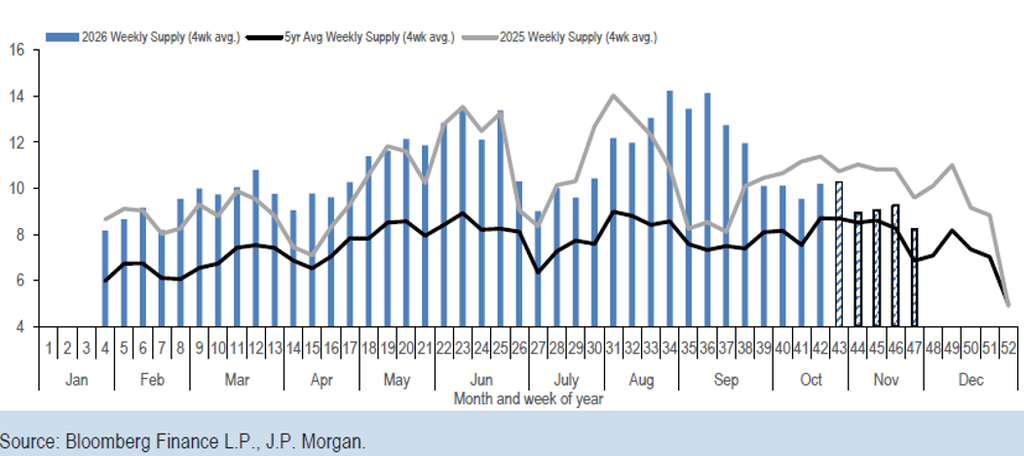
As we look toward the final months of the year, Clinton Investment Management maintains a highly constructive and offensive posture. The overarching macroeconomic backdrop remains clouded by significant crosscurrents, including lingering inflation doubts, evolving monetary policies, and intensifying global geopolitical tensions. However, it is precisely this uncertain backdrop that validates our strategic focus on high-quality, tax-exempt fixed income. Additionally, we expect supply to abate as we approach year-end as evidenced by the recent new issue projections shown in Figure 2 below.

Figure 2.
Our investment strategy, under current market conditions, is straightforward: lock in historically elevated yields now. Waiting for the absolute peak of an interest rate cycle is a notoriously difficult timing exercise that often results in missed opportunities. In our view, present yield levels offer a highly attractive entry point that provides an asymmetric payoff profile. If interest rates remain elevated, investors will continue to compound tax-free income at a rate that handily outpaces inflation. Conversely, if economic growth slows, and inflation cools, leading to a decline in interest rates, investors could enjoy meaningful capital appreciation across the municipal curve.

We expect the technical selling pressures observed in September will naturally subside as tax-loss harvesting programs conclude and institutional buyers step back in to capture market opportunities similar to what we are seeing. Given reduced supply expectations for the fourth quarter, any normalization in retail investor demand could trigger a rapid compression in yield/spreads, causing bond prices to recover just as quickly as they fell.

In conclusion, the third quarter delivered a stark reminder of how macro forces can disrupt short-term asset pricing. Yet, for the forward-thinking, long-term investor, it has reopened a window of opportunity that many believed was permanently closed. By focusing on the solid fundamental credit quality of the municipal market and capitalizing on the historically elevated TEYs available today, investors can confidently position themselves to navigate broader market volatility, secure their financial foundations, and capture the generational high in tax-free income streams municipal bonds now offer, which could serve them well into the future.

Important Disclosure Information

This material has been provided for informational purposes only and is not intended by Clinton Investment Management to provide and should not be relied on for tax, legal or accounting advice. If such advice is required, please consult with your own tax, legal and accounting advisors.

Investing involves risk including possible loss of principal.  Municipal bonds are subject to interest rate, credit, and market risk. Bond prices generally fall when interest rates rise. While municipal bond interest is generally exempt from federal income tax and, in some cases, state income tax, capital gains are taxable and certain income may be subject to the Alternative Minimum Tax (AMT).

Please remember that past performance may not be indicative of future results. Different types of investments involve varying degrees of risk, and there can be no assurance that the future performance of any specific investment, investment strategy, or product, made reference to directly or indirectly in this newsletter (article), will be profitable, equal any corresponding indicated historical performance level(s), or be suitable for your portfolio. Due to various factors, including changing market conditions, the content may no longer be reflective of current opinions or positions. Moreover, you should not assume that any discussion or information contained in this newsletter (article) serves as the receipt of, or as a substitute for, personalized investment advice from Clinton Investment Management, LLC. To the extent that a reader has any questions regarding the applicability of any specific issue discussed above to his/her individual situation, he/she is encouraged to consult with the professional advisor of his/her choosing. Please consult with an investment professional before making any investment using content or implied content from any investment manager. A copy of our current written disclosure statement discussing our advisory services and fees is available upon request.

The views and opinions expressed are not necessarily those of the distributing firm or any affiliates. Nothing discussed or suggested should be construed as permission to supersede or circumvent your firm’s policies, procedures, rules, and guidelines.

1JP Morgan Private Bank U.S., “Digging into the rare opportunity in muni bonds today,” 10/19/2026.

2CIM’s current Market Duration (NY Only) sample portfolio, as of October 20th, 2026, reflects a yield to worst of 4.48% which results in a tax equivalent yield (TEY) of 10.09% for a New York City resident in the highest tax bracket. The TEY to worst is calculated by dividing the tax-exempt yield by 1- the maximum federal income tax rate of 40.8% (37% federal + 3.80% NII tax) + the maximum NY income tax rate of 10.90% applicable to a single filer in the taxable income bracket over $25,000,000 + the NYC Local income tax rate of 3.88%. The sample portfolio is based on the current market environment and is not the result of actual trading. Actual client portfolios will differ for a variety of reasons including, but not limited to, account size, the timing of account funding, market conditions at the time of account funding and in the number, types, availability and diversity of securities that can be purchased, liquidity considerations and client objectives, guidelines and restrictions.

3Bloomberg Data

4The taxable equivalent yield (TEY) is calculated by dividing the tax-exempt yield by 1- the maximum federal income tax rate of 40.8% (37% federal + 3.80% NII tax).

5Moody’s: US municipal bond default and recovery rates, 1970-2024 | Default Report | Moody’s

What’s Driving Interest Rates Higher? Oil

Where is the Opportunity? Munis

The fixed-income market is experiencing a rare, time-sensitive window of opportunity for investors. As global capital markets transition through a cooling economic cycle and a changing monetary policy environment, history shows that opportunities to capture historically high yields in traditionally lower risk municipal bonds can vanish rapidly. For high-net-worth investors, acting quickly to lock in tax-free cash flow, at levels seen only on select occasions over the past twenty years could increase after-tax cash flow levels for decades to come.

  • Oil is the primary driver: If anyone wants to know what has been driving interest rates higher in the US and around the globe, the answer is very straightforward: higher oil prices. The correlation between the price of oil and US Treasury yields is over 90% over the past three months, according to Bloomberg. The breaking news here is that it is not budget deficits or the US government’s growing level of outstanding debt driving interest rates higher. Instead, the higher price of energy has been the primary catalyst pushing rates up around the world.
  • Historic 8% to 10% Taxable-Equivalent Yields1: High-grade and high-yield municipal bonds are currently generating some of the most compelling taxable-equivalent yields (TEY) observed in the post-pandemic era. For investors in the highest tax brackets, especially when factoring in combined federal, state, and local taxes, nominal, taxable-equivalent Muni yields equate to historical equity-like returns of 8% to 10%, without exposure to equity, corporate, or private credit risks.
  • A Shrinking Window for Peak Income: This highly unusual pricing anomaly represents a rare dislocation in the yield curve and broad fixed-income complex. As the broader macroeconomic cycle continues its shift, these high-income opportunities could vanish as quickly as they came, should oil prices decline, exerting downward pressure on inflation. What we know is that higher oil prices and corresponding higher interest rates are demand destroyers, not catalysts for faster economic growth.
  • Locking In Fixed-Rate Protections Now: Investors have the opportunity to increase after-tax, fixed cash flow, preserving a predictable income stream for potentially decades to come, while positioning their portfolio for potentially significant capital appreciation, should rates drift lower over time, as is our expectation.
  • Maximum Insulation from Tax Erosion: For investors residing in the highest tax brackets, the structural tax exemption of municipal securities offers immediate relief. It prevents the heavy tax drag that typically erodes fully taxable alternative investments, ensuring more cash flow stays in the portfolio.
  • Unmatched Generational Stability: Backed by essential public infrastructure, utilities, and state or local government tax autonomy, high-grade municipal bonds boast historical default rates well below 1% over multiple decades, according to Moody’s,2 offering a safe harbor in a late-cycle economy.
  • Unencumbered Asset Liquidity: Municipal securities provide clean, reliable liquidity and predictable revenues, entirely free from predatory fee structures, opaque valuations, or capital-access restrictions.

If you would like to learn more about the best way to capture the most compelling opportunities we are seeing, please let us know.

This material has been provided for informational purposes only and is not intended by Clinton Investment Management to provide and should not be relied on for tax, legal or accounting advice. If such advice is required, please consult with your own tax, legal and accounting advisors.

Please remember that past performance may not be indicative of future results. Net-of-fee performance returns are calculated by deducting the actual Clinton Investment Management, LLC investment management fee from the gross returns. Performance returns include the reinvestment of income and capital gains. Actual results may differ from the composite results depending upon the size of the account, investment objectives, guidelines and restrictions, inception of the account and other factors.  Different types of investments involve varying degrees of risk, and there can be no assurance that the future performance of any specific investment, investment strategy, or product, made reference to directly or indirectly in this newsletter (article), will be profitable, equal any corresponding indicated historical performance level(s), or be suitable for your portfolio. Due to various factors, including changing market conditions, the content may no longer be reflective of current opinions or positions. Moreover, you should not assume that any discussion or information contained in this newsletter (article) serves as the receipt of, or as a substitute for, personalized investment advice from Clinton Investment Management, LLC. To the extent that a reader has any questions regarding the applicability of any specific issue discussed above to his/her individual situation, he/she is encouraged to consult with the professional advisor of his/her choosing. Please consult with an investment professional before making any investment using content or implied content from any investment manager. A copy of our current written disclosure statement discussing our advisory services and fees is available upon request.

The views and opinions expressed are not necessarily those of the distributing firm or any affiliates. Nothing discussed or suggested should be construed as permission to supersede or circumvent your firm’s policies, procedures, rules, and guidelines.

1The taxable equivalent yield  to worst (TEY) is calculated by dividing the tax-exempt yield by 1- the maximum federal income tax rate of 40.8% (37% federal + 3.80% NII tax).

2Moody’s: US municipal bond default and recovery rates, 1970-2024 | Default Report | Moody’s

September 2, 2026

CEO Andrew Clinton spoke with Janet A. last week for SiriusXM’s The Business Briefing, where they discussed the latest in muni bonds. While airports across the country continue to expand and improve their infrastructure, investors in the asset class will be met with an opportunity set that is taking off.

Listen to the full episode here.

Please remember that past performance may not be indicative of future results. Net-of-fee performance returns are calculated by deducting the actual Clinton Investment Management, LLC investment management fee from the gross returns. Performance returns include the reinvestment of income and capital gains. Actual results may differ from the composite results depending upon the size of the account, investment objectives, guidelines and restrictions, inception of the account and other factors.  Different types of investments involve varying degrees of risk, and there can be no assurance that the future performance of any specific investment, investment strategy, or product, made reference to directly or indirectly in this newsletter (article), will be profitable, equal any corresponding indicated historical performance level(s), or be suitable for your portfolio. Due to various factors, including changing market conditions, the content may no longer be reflective of current opinions or positions. Moreover, you should not assume that any discussion or information contained in this newsletter (article) serves as the receipt of, or as a substitute for, personalized investment advice from Clinton Investment Management, LLC. To the extent that a reader has any questions regarding the applicability of any specific issue discussed above to his/her individual situation, he/she is encouraged to consult with the professional advisor of his/her choosing. Please consult with an investment professional before making any investment using content or implied content from any investment manager. A copy of our current written disclosure statement discussing our advisory services and fees is available upon request.


The views and opinions expressed are not necessarily those of the distributing firm or any affiliates. Nothing discussed or suggested should be construed as permission to supersede or circumvent your firm’s policies, procedures, rules, and guidelines.

August 31, 2026

CIM CEO Andrew Clinton’s comments were featured in yesterday’s coverage from The Bond Buyer on the overall health of the muni market throughout Q3.

As Andrew notes, rising demand amid elevated supply in the muni space is contributing to attractive yields relative across the asset class.

Read the full piece here.

Please remember that past performance may not be indicative of future results. Net-of-fee performance returns are calculated by deducting the actual Clinton Investment Management, LLC investment management fee from the gross returns. Performance returns include the reinvestment of income and capital gains. Actual results may differ from the composite results depending upon the size of the account, investment objectives, guidelines and restrictions, inception of the account and other factors.  Different types of investments involve varying degrees of risk, and there can be no assurance that the future performance of any specific investment, investment strategy, or product, made reference to directly or indirectly in this newsletter (article), will be profitable, equal any corresponding indicated historical performance level(s), or be suitable for your portfolio. Due to various factors, including changing market conditions, the content may no longer be reflective of current opinions or positions. Moreover, you should not assume that any discussion or information contained in this newsletter (article) serves as the receipt of, or as a substitute for, personalized investment advice from Clinton Investment Management, LLC. To the extent that a reader has any questions regarding the applicability of any specific issue discussed above to his/her individual situation, he/she is encouraged to consult with the professional advisor of his/her choosing. Please consult with an investment professional before making any investment using content or implied content from any investment manager. A copy of our current written disclosure statement discussing our advisory services and fees is available upon request.


The views and opinions expressed are not necessarily those of the distributing firm or any affiliates. Nothing discussed or suggested should be construed as permission to supersede or circumvent your firm’s policies, procedures, rules, and guidelines.

August 31, 2026

At Clinton Investment Management, we think it’s important to be mindful of the key indicators that have a meaningful relationship with Treasury yields. CEO Andrew Clinton shared as much this week with Debtwire as part of their coverage on the widening federal deficit and its effect, or lack thereof, on muni credits.

Read the full piece here (paywalled).

Please remember that past performance may not be indicative of future results. Net-of-fee performance returns are calculated by deducting the actual Clinton Investment Management, LLC investment management fee from the gross returns. Performance returns include the reinvestment of income and capital gains. Actual results may differ from the composite results depending upon the size of the account, investment objectives, guidelines and restrictions, inception of the account and other factors.  Different types of investments involve varying degrees of risk, and there can be no assurance that the future performance of any specific investment, investment strategy, or product, made reference to directly or indirectly in this newsletter (article), will be profitable, equal any corresponding indicated historical performance level(s), or be suitable for your portfolio. Due to various factors, including changing market conditions, the content may no longer be reflective of current opinions or positions. Moreover, you should not assume that any discussion or information contained in this newsletter (article) serves as the receipt of, or as a substitute for, personalized investment advice from Clinton Investment Management, LLC. To the extent that a reader has any questions regarding the applicability of any specific issue discussed above to his/her individual situation, he/she is encouraged to consult with the professional advisor of his/her choosing. Please consult with an investment professional before making any investment using content or implied content from any investment manager. A copy of our current written disclosure statement discussing our advisory services and fees is available upon request.


The views and opinions expressed are not necessarily those of the distributing firm or any affiliates. Nothing discussed or suggested should be construed as permission to supersede or circumvent your firm’s policies, procedures, rules, and guidelines.

August 13, 2026

Brian Bandell of South Florida Business Journal discussed the latest developments on a topic we know well, Brightline Florida, with CIM CEO Andrew Clinton.

As Andrew notes, while bonds can be exchanged for equity, Brightline’s need for liquidity still isn’t answered, and where it’s coming from remains a key question.

“We’ve never seen anything like it, based on the projections that were made and what actually transpired, with such a wide gap,” Andrew said.

Read the full piece here.

Please remember that past performance may not be indicative of future results. Net-of-fee performance returns are calculated by deducting the actual Clinton Investment Management, LLC investment management fee from the gross returns. Performance returns include the reinvestment of income and capital gains. Actual results may differ from the composite results depending upon the size of the account, investment objectives, guidelines and restrictions, inception of the account and other factors.  Different types of investments involve varying degrees of risk, and there can be no assurance that the future performance of any specific investment, investment strategy, or product, made reference to directly or indirectly in this newsletter (article), will be profitable, equal any corresponding indicated historical performance level(s), or be suitable for your portfolio. Due to various factors, including changing market conditions, the content may no longer be reflective of current opinions or positions. Moreover, you should not assume that any discussion or information contained in this newsletter (article) serves as the receipt of, or as a substitute for, personalized investment advice from Clinton Investment Management, LLC. To the extent that a reader has any questions regarding the applicability of any specific issue discussed above to his/her individual situation, he/she is encouraged to consult with the professional advisor of his/her choosing. Please consult with an investment professional before making any investment using content or implied content from any investment manager. A copy of our current written disclosure statement discussing our advisory services and fees is available upon request.


The views and opinions expressed are not necessarily those of the distributing firm or any affiliates. Nothing discussed or suggested should be construed as permission to supersede or circumvent your firm’s policies, procedures, rules, and guidelines.

August 11, 2026

For investors patiently waiting on the next airport mega bond sale, Atlanta is bucking the trend on what has been a slow year so far in the sector. As CEO Andrew Clinton told Bloomberg’s Aashna Shah, infrastructure opportunities like this haven’t been as prevalent because of the large-scale activity last year.

“There aren’t very large projects and needs for capital financing at the moment,” Andrew noted. “So therefore they’re not in the frequency of issuing because they don’t need to.”

Read the full piece here.

Please remember that past performance may not be indicative of future results. Net-of-fee performance returns are calculated by deducting the actual Clinton Investment Management, LLC investment management fee from the gross returns. Performance returns include the reinvestment of income and capital gains. Actual results may differ from the composite results depending upon the size of the account, investment objectives, guidelines and restrictions, inception of the account and other factors.  Different types of investments involve varying degrees of risk, and there can be no assurance that the future performance of any specific investment, investment strategy, or product, made reference to directly or indirectly in this newsletter (article), will be profitable, equal any corresponding indicated historical performance level(s), or be suitable for your portfolio. Due to various factors, including changing market conditions, the content may no longer be reflective of current opinions or positions. Moreover, you should not assume that any discussion or information contained in this newsletter (article) serves as the receipt of, or as a substitute for, personalized investment advice from Clinton Investment Management, LLC. To the extent that a reader has any questions regarding the applicability of any specific issue discussed above to his/her individual situation, he/she is encouraged to consult with the professional advisor of his/her choosing. Please consult with an investment professional before making any investment using content or implied content from any investment manager. A copy of our current written disclosure statement discussing our advisory services and fees is available upon request.


The views and opinions expressed are not necessarily those of the distributing firm or any affiliates. Nothing discussed or suggested should be construed as permission to supersede or circumvent your firm’s policies, procedures, rules, and guidelines.

August 7, 2026

Thank you to Aashna Shah of Bloomberg for including CIM’s CEO Andrew Clinton in a report on Puerto Rico’s $121 million muni bond sale this week. As Andrew notes, investors faced a rare opportunity to acquire stable credits following a lack of BBB issuances this year.

“It just came to the market at the right time,” he said. “People are starved in terms of demand for that type of paper, and it was an attractive yield.”

Read the full piece here.

Please remember that past performance may not be indicative of future results. Net-of-fee performance returns are calculated by deducting the actual Clinton Investment Management, LLC investment management fee from the gross returns. Performance returns include the reinvestment of income and capital gains. Actual results may differ from the composite results depending upon the size of the account, investment objectives, guidelines and restrictions, inception of the account and other factors.  Different types of investments involve varying degrees of risk, and there can be no assurance that the future performance of any specific investment, investment strategy, or product, made reference to directly or indirectly in this newsletter (article), will be profitable, equal any corresponding indicated historical performance level(s), or be suitable for your portfolio. Due to various factors, including changing market conditions, the content may no longer be reflective of current opinions or positions. Moreover, you should not assume that any discussion or information contained in this newsletter (article) serves as the receipt of, or as a substitute for, personalized investment advice from Clinton Investment Management, LLC. To the extent that a reader has any questions regarding the applicability of any specific issue discussed above to his/her individual situation, he/she is encouraged to consult with the professional advisor of his/her choosing. Please consult with an investment professional before making any investment using content or implied content from any investment manager. A copy of our current written disclosure statement discussing our advisory services and fees is available upon request.


The views and opinions expressed are not necessarily those of the distributing firm or any affiliates. Nothing discussed or suggested should be construed as permission to supersede or circumvent your firm’s policies, procedures, rules, and guidelines.

Municipal Bond Taxable Equivalent Yields Now Rival Those of Private Credit

  • Clinton Investment Management’s Municipal Credit Opportunities yield-to-worst of 4.31% equates to roughly 9% when compared to corporate bonds or over 7.25% when compared to Treasuries, for those in the highest tax bracket living in a high tax state like New York.
  • Contrasting with the private credit market, an asset class that has attracted sizeable capital inflows over the past several years, the relative value proposition shifts heavily toward municipals.
  • We are of the firm belief that the structural fundamentals of municipal bonds provide a superior layer of investor protection compared to the opaque world of private corporate lending.
  • The domestic economic engine experienced a pronounced slowdown, with advanced gross domestic product estimates revealing the U.S. economy decelerated sharply to a 1.5% annualized growth rate, a steep drop from the 2% expansion recorded in the first quarter of the year.
  • The outlook for the municipal bond market remains exceedingly advantageous, in our view, as the convergence of slowing economic growth, a softening labor market, and a constrained central bank creates a constructive fundamental and technical backdrop for the asset class.

The second quarter of 2026 marked a pivotal transition period for global capital markets, characterized by a pronounced deceleration in domestic economic activity and an increasingly complex monetary policy landscape. For high-net-worth investors navigating this shifting macroeconomic terrain, the fixed-income markets offered divergent paths. On one hand, the broader corporate and private lending landscape began to exhibit symptoms of late-cycle fatigue, compressed spreads, and rising credit vulnerabilities. On the other hand, the municipal bond market emerged as an exceptionally resilient and fundamentally mispriced asset class. As tax burdens continue to erode nominal investment returns for individual investors in the highest tax brackets, the structural benefits of municipal securities have become glaringly apparent. Underneath the short-term market noise, macroeconomic data points to an economic cooling cycle that favors high-quality, fixed income assets. For capital allocators analyzing the relative value landscape, the tax-exempt arena currently presents an asymmetric risk-reward profile that outclasses highly leveraged corporate alternatives.

A rigorous evaluation of asset class fundamentals reveals that high-grade municipal bonds offer some of the most compelling taxable-equivalent yields observed in the post-pandemic era. For example, Clinton Investment Management’s Municipal Credit Opportunities yield-to-worst of 4.31%1 equates to roughly 9% when compared to corporate bonds or over 7.25% when compared to Treasuries, for those in the highest tax bracket living in a high tax state like New York2. Contrasting with the private credit market, an asset class that has attracted sizeable capital inflows over the past several years, the relative value proposition shifts heavily toward municipals. Private credit has traditionally positioned itself as a high-yielding alternative to traditional fixed income, yet its returns are fully taxable, severely diluting the net yield delivered to wealthy individuals. Furthermore, the private credit landscape is experiencing a rapid degradation in credit quality, with middle-market corporate borrowers facing intense margin compression from sustained elevated borrowing costs. The municipal market, however, offers investors exposure to sectors such as public infrastructure, utility systems, and state and local governments that possess tax autonomy, pricing power given essentiality of services they provide, together with historically stable, predictable revenue streams. In addition, municipal tax revenues are projected to increase, given widescale AI adoption at the enterprise level and resultant data center construction.

We are of the firm belief that the structural fundamentals of municipal bonds provide a superior layer of investor protection compared to the opaque world of private corporate lending. Historically, high-grade municipal securities have exhibited exceptionally low default rates, remaining well below one percent over multiple decades, according to Moodys’ Credit Default Study, 2024 data3. This sharply contrasts with the private credit market, where industry analysts are observing escalating corporate fragility and default rates climbing toward six percent among over-leveraged middle-market companies, according to Fitch4. This vast gulf in credit risk is exacerbated by the exorbitant fee structures embedded in private credit funds, which frequently charge two percent management fees alongside twenty percent performance hurdles for funds exposed to a meaningful degree of leverage. Heavy fee drag can result in a significant reduction of private credit investor returns over time, whereas active municipal asset management utilizes transparent, lower cost Separately Managed Account structures that maximize the pass-through of interest income to the underlying client. The liquidity dynamics of the two asset classes also illustrate the operational advantages inherent in the municipal bond market. Private credit vehicles routinely protect their illiquid underlying portfolios by implementing restrictive redemption terms, including the frequent deployment of multi-year capital lock-up periods and liquidity gates. During periods of economic stress, investors in these private funds often find themselves trapped, unable to reallocate capital as credit conditions deteriorate. Municipal bonds, conversely, typically trade within a deep, highly transparent institutional secondary market, allowing for continuous portfolio optimization, tax-loss harvesting, and a high level of liquidity without arbitrary holding penalties or withdrawal restrictions. This operational freedom ensures that wealth managers can dynamically adjust portfolio positioning as macroeconomic variables evolve. The structural contrast extends to the type of interest rate exposure embedded in these respective asset classes. Private credit is fundamentally built upon floating-rate debt instruments, a feature that benefited investors during the Federal Reserve’s aggressive tightening cycle but has now transformed into a distinct vulnerability. As the broader economy slows, corporate borrowers under floating-rate arrangements face immense debt-service pressure, and looming maturity walls, while investors are exposed to the risk of rapidly declining yields once monetary policy begins to ease. Municipal bonds are predominantly structured with fixed coupon rates, allowing informed investors to lock in high terminal yields for an extended period, should interest rates remain stable or decline over time, as is our expectation. By capturing these fixed rates at the cyclical peak of the interest rate cycle, municipal bond investors can further reduce their portfolio exposures to reinvestment risk which will inevitably plague floating-rate private credit strategies as benchmark yields move lower. It is important to remember that municipal bonds provide liquidity within one business day, in most circumstances, providing investors with the flexibility to adjust exposures as market conditions shift rather than when the investment manager deems the timing appropriate, as is currently the case for many investors currently gated in private credit vehicles.

The necessity of locking in these fixed yields is underscored by the macroeconomic data that defined the second quarter of 2026. The domestic economic engine experienced a pronounced slowdown, with advanced gross domestic product estimates revealing the U.S. economy decelerated sharply to a 1.5% annualized growth rate, a steep drop from the 2% expansion recorded in the first quarter of the year. This cooling economic trajectory was reinforced by a sudden and severe softening in the domestic labor market. The June 2026 non-farm payrolls report delivered a downward surprise to market participants, expanding by a mere 57,000 jobs and missing consensus expectations by more than half. This data illustrates that the labor sector, which had long served as the primary pillar of economic resilience, is no longer running hot and may be succumbing to the restrictive monetary environment.

While a volatile geopolitical energy landscape has kept headline inflation figures sticky and prevented an immediate, aggressive pivot toward monetary easing, this combination of anemic gross domestic product growth and a weakening employment backdrop is likely to pressure the Federal Reserve, Chairman Kevin Warsh and the Federal Open Market Committee. Recognizing the fragility of the economic expansion, the central bank opted to hold benchmark interest rates steady within the 3.50% – 3.75% range at its most recent meeting. The Federal Reserve is effectively handcuffed, constrained from pursuing further policy tightening by explicit signs of economic fatigue, yet hesitant to cut rates prematurely due to lingering, and potentially transient, localized price pressures. This prolonged pause by the monetary authorities establishes a highly favorable environment for fixed-income assets, as it removes the threat of further upward rate shocks while signaling that the next structural move in interest rates may be a cut as opposed to a hike.

Looking ahead, the outlook for the municipal bond market remains exceedingly advantageous, in our view, as the convergence of slowing economic growth, a softening labor market, and a constrained central bank creates a constructive fundamental and technical backdrop for the asset class. As cash yields on short-term instruments begin to lose their luster, we expect a meaningful rotation of capital out of money market funds and preferred savings vehicles back into long-term fixed-income securities, creating a powerful technical tailwind that will support valuations. Investors who proactively extend duration within municipal portfolios offering higher yields, stand to achieve not only elevated tax-free cash flow but may also enjoy significant capital appreciation alongside highly durable, tax-sheltered income streams. In an environment where corporate balance sheets may be pressured by rising input costs and the inability to pass on those higher costs to consumers already under financial strain, at the same time that private market vehicles are limiting redemptions, the clarity, safety, and attractive taxable-equivalent yields of the municipal bond market represent a haven for capital preservation and compelling tax-free cash flow. Active portfolio management and disciplined credit selection will remain paramount in separating premier underlying credits from localized areas of fiscal stress, enabling investors to fully capitalize on these unique macroeconomic conditions, against an uncertain economic and geopolitical backdrop.

Important Disclosure Information

This material has been provided for informational purposes only and is not intended by Clinton Investment Management to provide and should not be relied on for tax, legal or accounting advice. If such advice is required, please consult with your own tax, legal and accounting advisors.

Please remember that past performance may not be indicative of future results. Net-of-fee performance returns are calculated by deducting the actual Clinton Investment Management, LLC investment management fee from the gross returns. Performance returns include the reinvestment of income and capital gains. Actual results may differ from the composite results depending upon the size of the account, investment objectives, guidelines and restrictions, inception of the account and other factors.  Different types of investments involve varying degrees of risk, and there can be no assurance that the future performance of any specific investment, investment strategy, or product, made reference to directly or indirectly in this newsletter (article), will be profitable, equal any corresponding indicated historical performance level(s), or be suitable for your portfolio. Due to various factors, including changing market conditions, the content may no longer be reflective of current opinions or positions. Moreover, you should not assume that any discussion or information contained in this newsletter (article) serves as the receipt of, or as a substitute for, personalized investment advice from Clinton Investment Management, LLC. To the extent that a reader has any questions regarding the applicability of any specific issue discussed above to his/her individual situation, he/she is encouraged to consult with the professional advisor of his/her choosing. Please consult with an investment professional before making any investment using content or implied content from any investment manager. A copy of our current written disclosure statement discussing our advisory services and fees is available upon request.

The views and opinions expressed are not necessarily those of the distributing firm or any affiliates. Nothing discussed or suggested should be construed as permission to supersede or circumvent your firm’s policies, procedures, rules, and guidelines.

1Yield Data is derived from our Municipal Credit Opportunities composite as of 07/31/2026 and is subject to change.

2The taxable equivalent yield (TEY) is calculated by dividing the tax-exempt yield by 1- the maximum federal income tax rate of 40.8% (37% federal + 3.80% NII tax) + the maximum NY income tax rate of 6.85% applicable to a joint filer in the taxable income bracket between $323,201 and $2,155,350 + the NYC Local income tax rate of 3.88%. Taxable income above this bracket will result in a higher TEY.

3Moody’s: US municipal bond default and recovery rates, 1970-2024 | Default Report | Moody’s

4Fitch Ratings-U.S. Private Credit Default Rates Remains at Record High 6.0% in May 2026, June 15, 2026.

July 15, 2026

Our CEO, Andrew Clinton, shared his thoughts with Martin Braun of Bloomberg on on Aquarion Water Authority’s buyout of Eversource Energy using muni bonds. If priced less aggressively than previous deals in the state, investors can see benefits including lower leverage and higher credit quality.

Read the full piece here.

Please remember that past performance may not be indicative of future results. Net-of-fee performance returns are calculated by deducting the actual Clinton Investment Management, LLC investment management fee from the gross returns. Performance returns include the reinvestment of income and capital gains. Actual results may differ from the composite results depending upon the size of the account, investment objectives, guidelines and restrictions, inception of the account and other factors.  Different types of investments involve varying degrees of risk, and there can be no assurance that the future performance of any specific investment, investment strategy, or product, made reference to directly or indirectly in this newsletter (article), will be profitable, equal any corresponding indicated historical performance level(s), or be suitable for your portfolio. Due to various factors, including changing market conditions, the content may no longer be reflective of current opinions or positions. Moreover, you should not assume that any discussion or information contained in this newsletter (article) serves as the receipt of, or as a substitute for, personalized investment advice from Clinton Investment Management, LLC. To the extent that a reader has any questions regarding the applicability of any specific issue discussed above to his/her individual situation, he/she is encouraged to consult with the professional advisor of his/her choosing. Please consult with an investment professional before making any investment using content or implied content from any investment manager. A copy of our current written disclosure statement discussing our advisory services and fees is available upon request.


The views and opinions expressed are not necessarily those of the distributing firm or any affiliates. Nothing discussed or suggested should be construed as permission to supersede or circumvent your firm’s policies, procedures, rules, and guidelines.